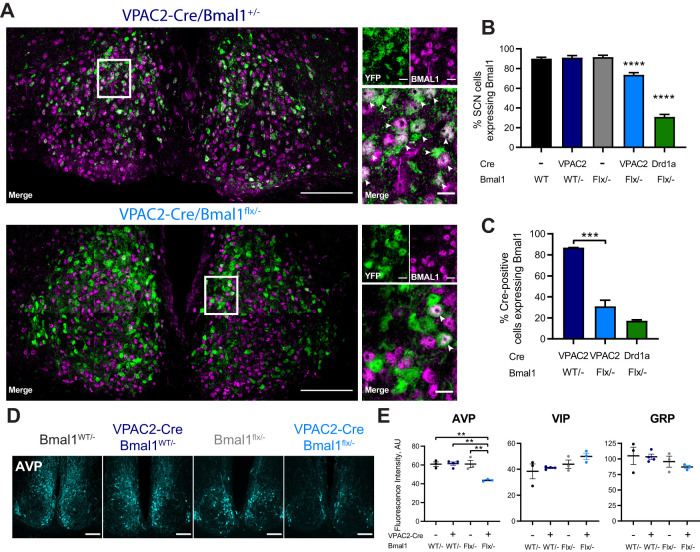
Figure 3.
Targeted deletion of BMAL1 from VPAC2-Cre-expressing SCN cells. A, Representative 63× tiled confocal micrographs of Cre recombinase activity, as reported by a genetically encoded EYFP reporter (green), and BMAL1 immunohistochemistry (magenta) in VPAC2-Cre/Bmal1WT/– and VPAC2-Cre/Bmal1flx/– SCN sections. White rectangles represent locations of magnified images. White arrowheads indicate colocalization between EYFP and BMAL1-ir. Scale bars: stitched images, 100 µm; magnified images, 10 µm. B, Percentage of SCN cells (marked by DAPI; mean ± SEM) expressing BMAL1-ir across genotypes, including Drd1a-Cre/Bmal1flx/–. C, Percentage of Cre-positive cells (marked by EYFP; mean ± SEM) expressing BMAL1-ir across genotypes. B, C, One-way ANOVA with Tukey's post hoc test. D, Representative images of AVP-ir in SCN of VPAC2-Cre/Bmal1flx/– mice and controls. Scale bars, 100 µm. E, Fluorescence intensities (mean ± SEM) for immunohistochemical staining of AVP (left), VIP (middle), and GRP (right) in SCN sections of VPAC2-Cre/Bmal1flx/– mice and controls. B, C, n = 7 (Bmal1WT/–), n = 7 (Bmal1flx/–), n = 2 (VPAC2-Cre/Bmal1WT/–), n = 8 (VPAC2-Cre/Bmal1flx/–), and n = 3 (Drd1a-Cre/Bmal1flx/–). E, n = 3 per group. **p < 0.01; ***p < 0.001; ****p < 0.0001; two-way ANOVA with Tukey's post hoc test.

