Figure 2.
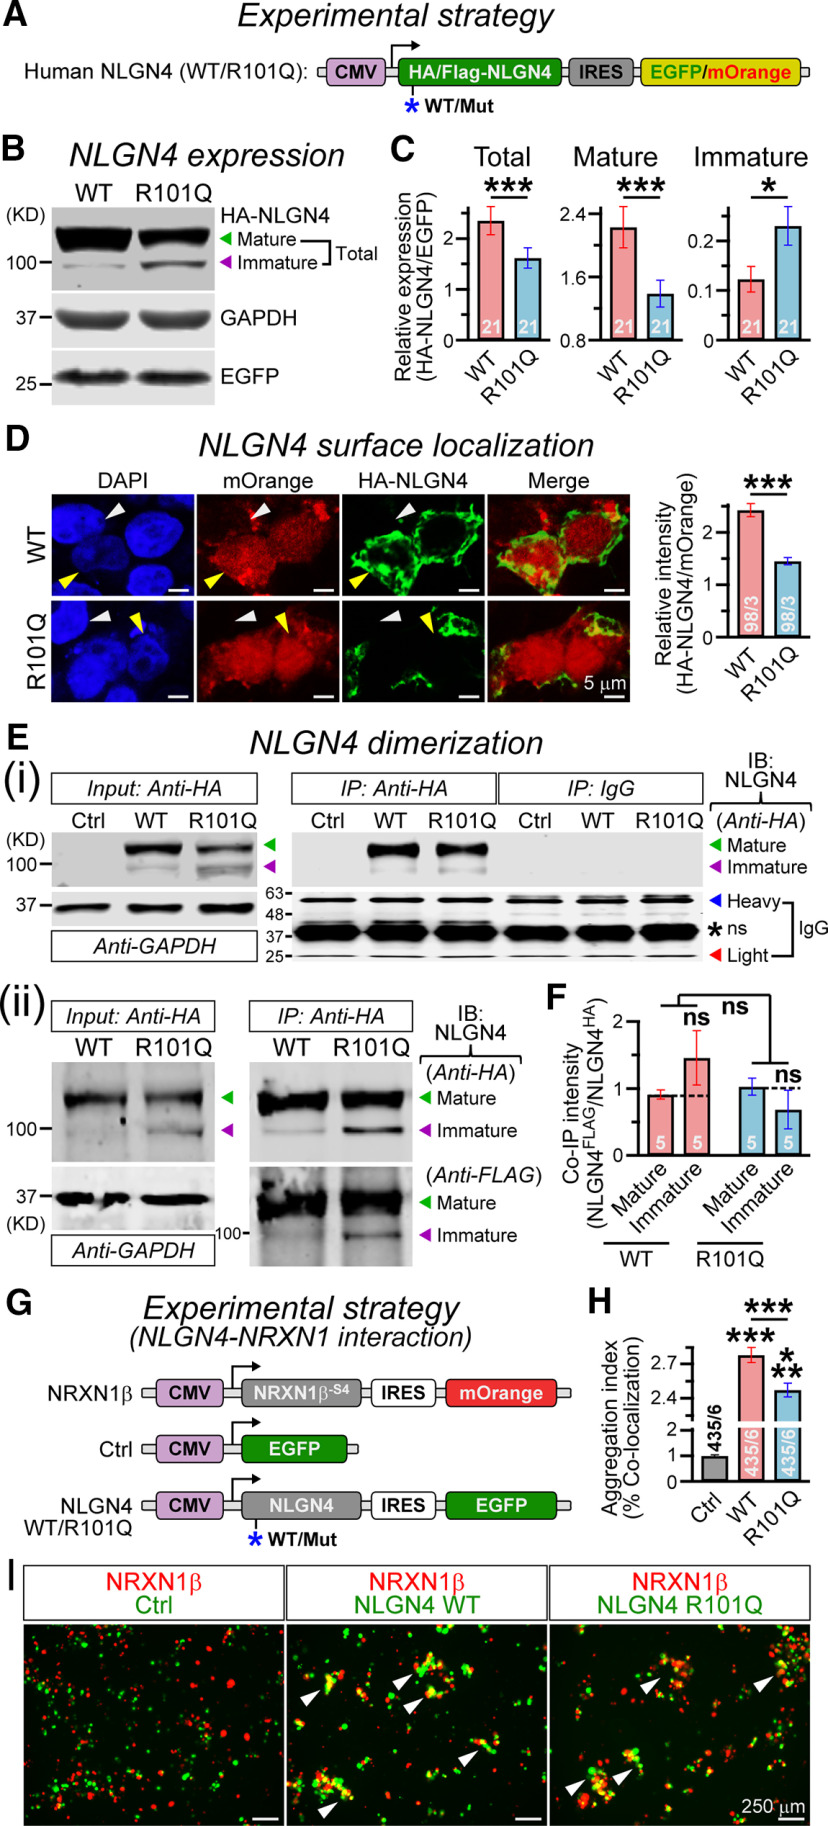
R101Q mutation prevents maturation and surface localization of NLGN4. A, Design of NLGN4 (WT/R101Q) expression vectors (for details, see Materials and Methods). B, Representative immunoblot of HA-tagged NLGN4 (top) collected from HEK293 cells expressing NLGN4 WT or R101Q variant; arrowheads indicate mature (green) versus immature (purple) NLGN4 products. GAPDH was used as a loading control (middle), and EGFP was used as a transfection control (bottom). C, Bar graphs summarize relative expression of total (mature + immature; left), mature (middle), or immature (right) products in WT versus R101Q conditions, when normalized to corresponding EGFP levels. D, Sample images (left) of HEK293 cells transfected with NLGN4 WT (top) and R101Q (bottom) constructs coexpressing mOrange (red), immunolabeled with HA antibody under nonpermeabilized condition (green), and counterstained for DAPI (blue). Yellow versus white arrowheads point at transfected versus nontransfected cells, respectively. Summary graph (right) of HA-NLGN4 surface expression normalized to mOrange signal intensity. Ei, Immunoprecipitation experiment from HEK293 cells in untransfected control (Ctrl) or those expressing HA-tagged NLGN4 (WT vs R101Q) constructs: sample immunoblots (IBs) with anti-HA antibody for 10% input (left; with GAPDH as a loading control), or when immunoprecipitated (IP) with anti-HA antibody versus IgG control (right); arrowheads point at mature (green) versus immature (purple) NLGN4 products, IgG heavy chains (blue) or IgG light chains (red), and asterisk indicates a nonspecific (ns) “sticky” band. Eii, To assess NLGN4 dimerization, both HA- and FLAG-tagged versions of NLGN4 were coexpressed in HEK cells, immunoprecipitated with anti-HA antibody (right), and the same lanes were immunolabeled with mouse anti-HA versus rabbit anti-FLAG antibodies. F, Summary graph indicates the relative intensity of immunoprecipitated FLAG-NLGN4 compared with HA-NLGN4, for mature versus immature products in WT versus R101Q conditions. G, Experimental strategy for probing NLGN4–NRXN interaction (for details, see Materials and Methods). H, I, Average bar graphs (H) and example images (I) of aggregates (white arrowheads) formed by HEK cells expressing NRXN with mOrange reporter, and either control vector or NLGN4 (WT/R101Q) with EGFP reporter. Quantification of cell aggregates were performed using Mander's coefficient of colocalization, and normalized to control condition. All numerical data are presented as the mean ± SEM, with total number of batches analyzed (for Western blots) or field of views analyzed/independent batches (for imaging). Statistical significance was evaluated by two-tailed, unpaired (paired for batchwise comparisons, C, F), Student's t test or one-way ANOVA (across all conditions, F). ***p < 0.005; *p < 0.05; ns, not significant (p > 0.05).

