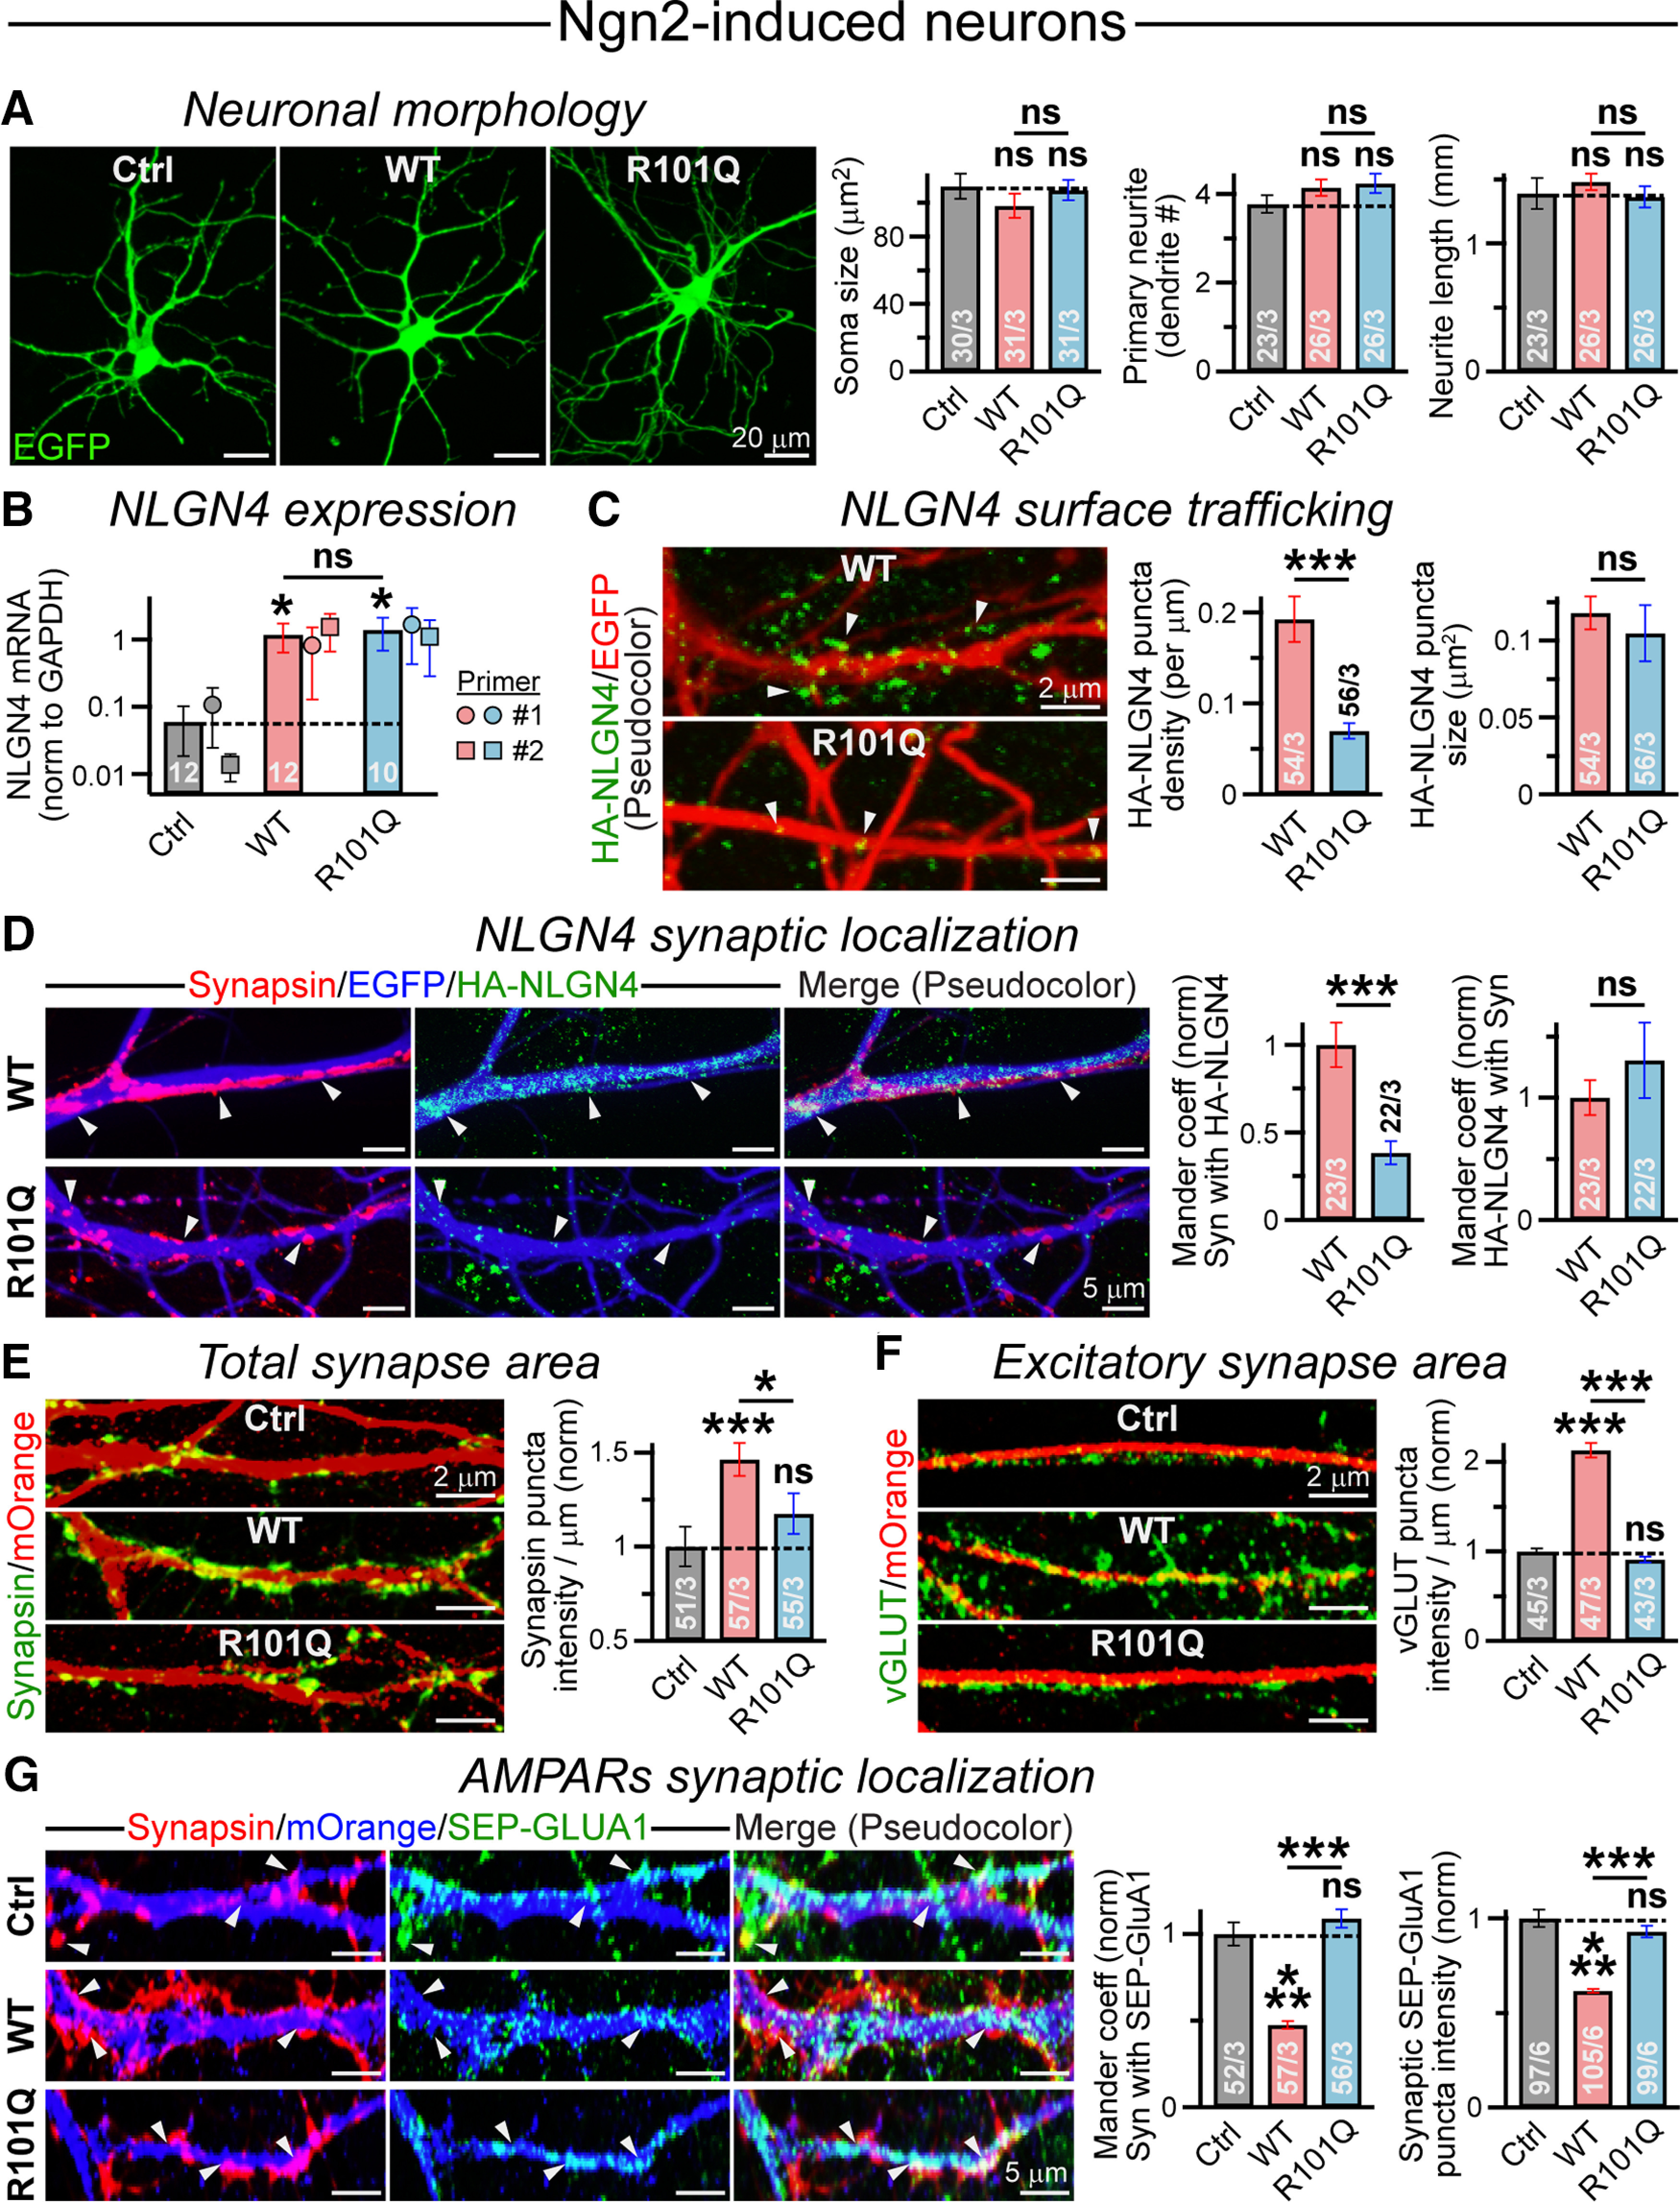
Figure 8.

R101Q mutation impairs NLGN4 synaptic localization and inhibits NLGN4-mediated reduction in synaptic AMPAR clusters. A, Representative images (left) of Ngn2-induced human neurons expressing either a control (Ctrl) vector or NLGN4 WT versus R101Q variant, as their morphologic parameters were assessed using an EGFP reporter. Summary graphs (right) of soma size, primary dendrite number, and average neurite length per cell. B, NLGN4 mRNA levels were estimated by quantitative real-time PCR and normalized to those of GAPDH (internal control) for Ngn2-induced neurons expressing either a control vector, or NLGN4 WT versus R101Q mutant constructs. The average bar graphs combine values from two independent primer sets (set 1: circles; n = 6 Ctrl, 6 WT, and 5 for R101Q; and set 2: squares; n = 6 Ctrl, 6 WT, and 5 for R101Q). C, Sample images (left) of EGFP-expressing dendritic segments (pseudocolored for better visibility) from NLGN4 WT (top) versus R101Q (bottom) conditions, when immunostained with anti-HA antibody (arrowheads) under nonpermeabilized state. Summary graphs (right) of surface HA-NLGN4 puncta density and size. D, Representative images (left) of EGFP-labeled dendritic segments from WT (top) versus R101Q (bottom) conditions, when incubated with anti-HA antibody under nonpermeabilized state, then permeabilized and coimmunostained with Synapsin antibody. The channel colors were artificially reassigned to provide better visibility for synaptic signals; arrowheads point at synaptic puncta. Summary graphs (right) indicate synaptic distribution of NLGN4, characterized using normalized Mander's colocalization coefficients between HA-NLGN4 and Synapsin signals. E, F, Dendritic sections of mOrange-expressing human neurons from control, NLGN4 WT, and NLGN4 R101Q conditions immunostained with either Synapsin (E, left) or VGluT (F, left) antibody, and integrated intensity of Synapsin (E, right) or VGluT (F, right) puncta normalized with respect to the dendrite length. G, Neurons expressed either a control vector or NLGN4 WT versus R101Q mutant followed by mOrange reporter. Sample images (left; pseudocolor) of dendritic branches immunolabeled for surface AMPARs (SEP-GluA1) using anti-GFP antibody under nonpermeabilized condition, subsequently permeabilized and stained with anti-Synapsin antibody. Arrowheads indicate synaptic clusters; note that many lack copresence of SEP-GluA1 in WT condition. Summary graphs (right) of normalized Mander's coefficient indicating a Synapsin (Syn) puncta fraction containing SEP-GluA1 signal and the intensity of SEP-GluA1 puncta colocalized with Synapsin. Average bar graphs represent the mean ± SEM, with the number of frames analyzed/number of experiments, or only the number of independent batches (for B). Statistical significance was assessed by two-tailed, unpaired (one-tailed and paired for B), Student's t test. ***p < 0.005; *p < 0.05; ns, not significant (p > 0.05).
