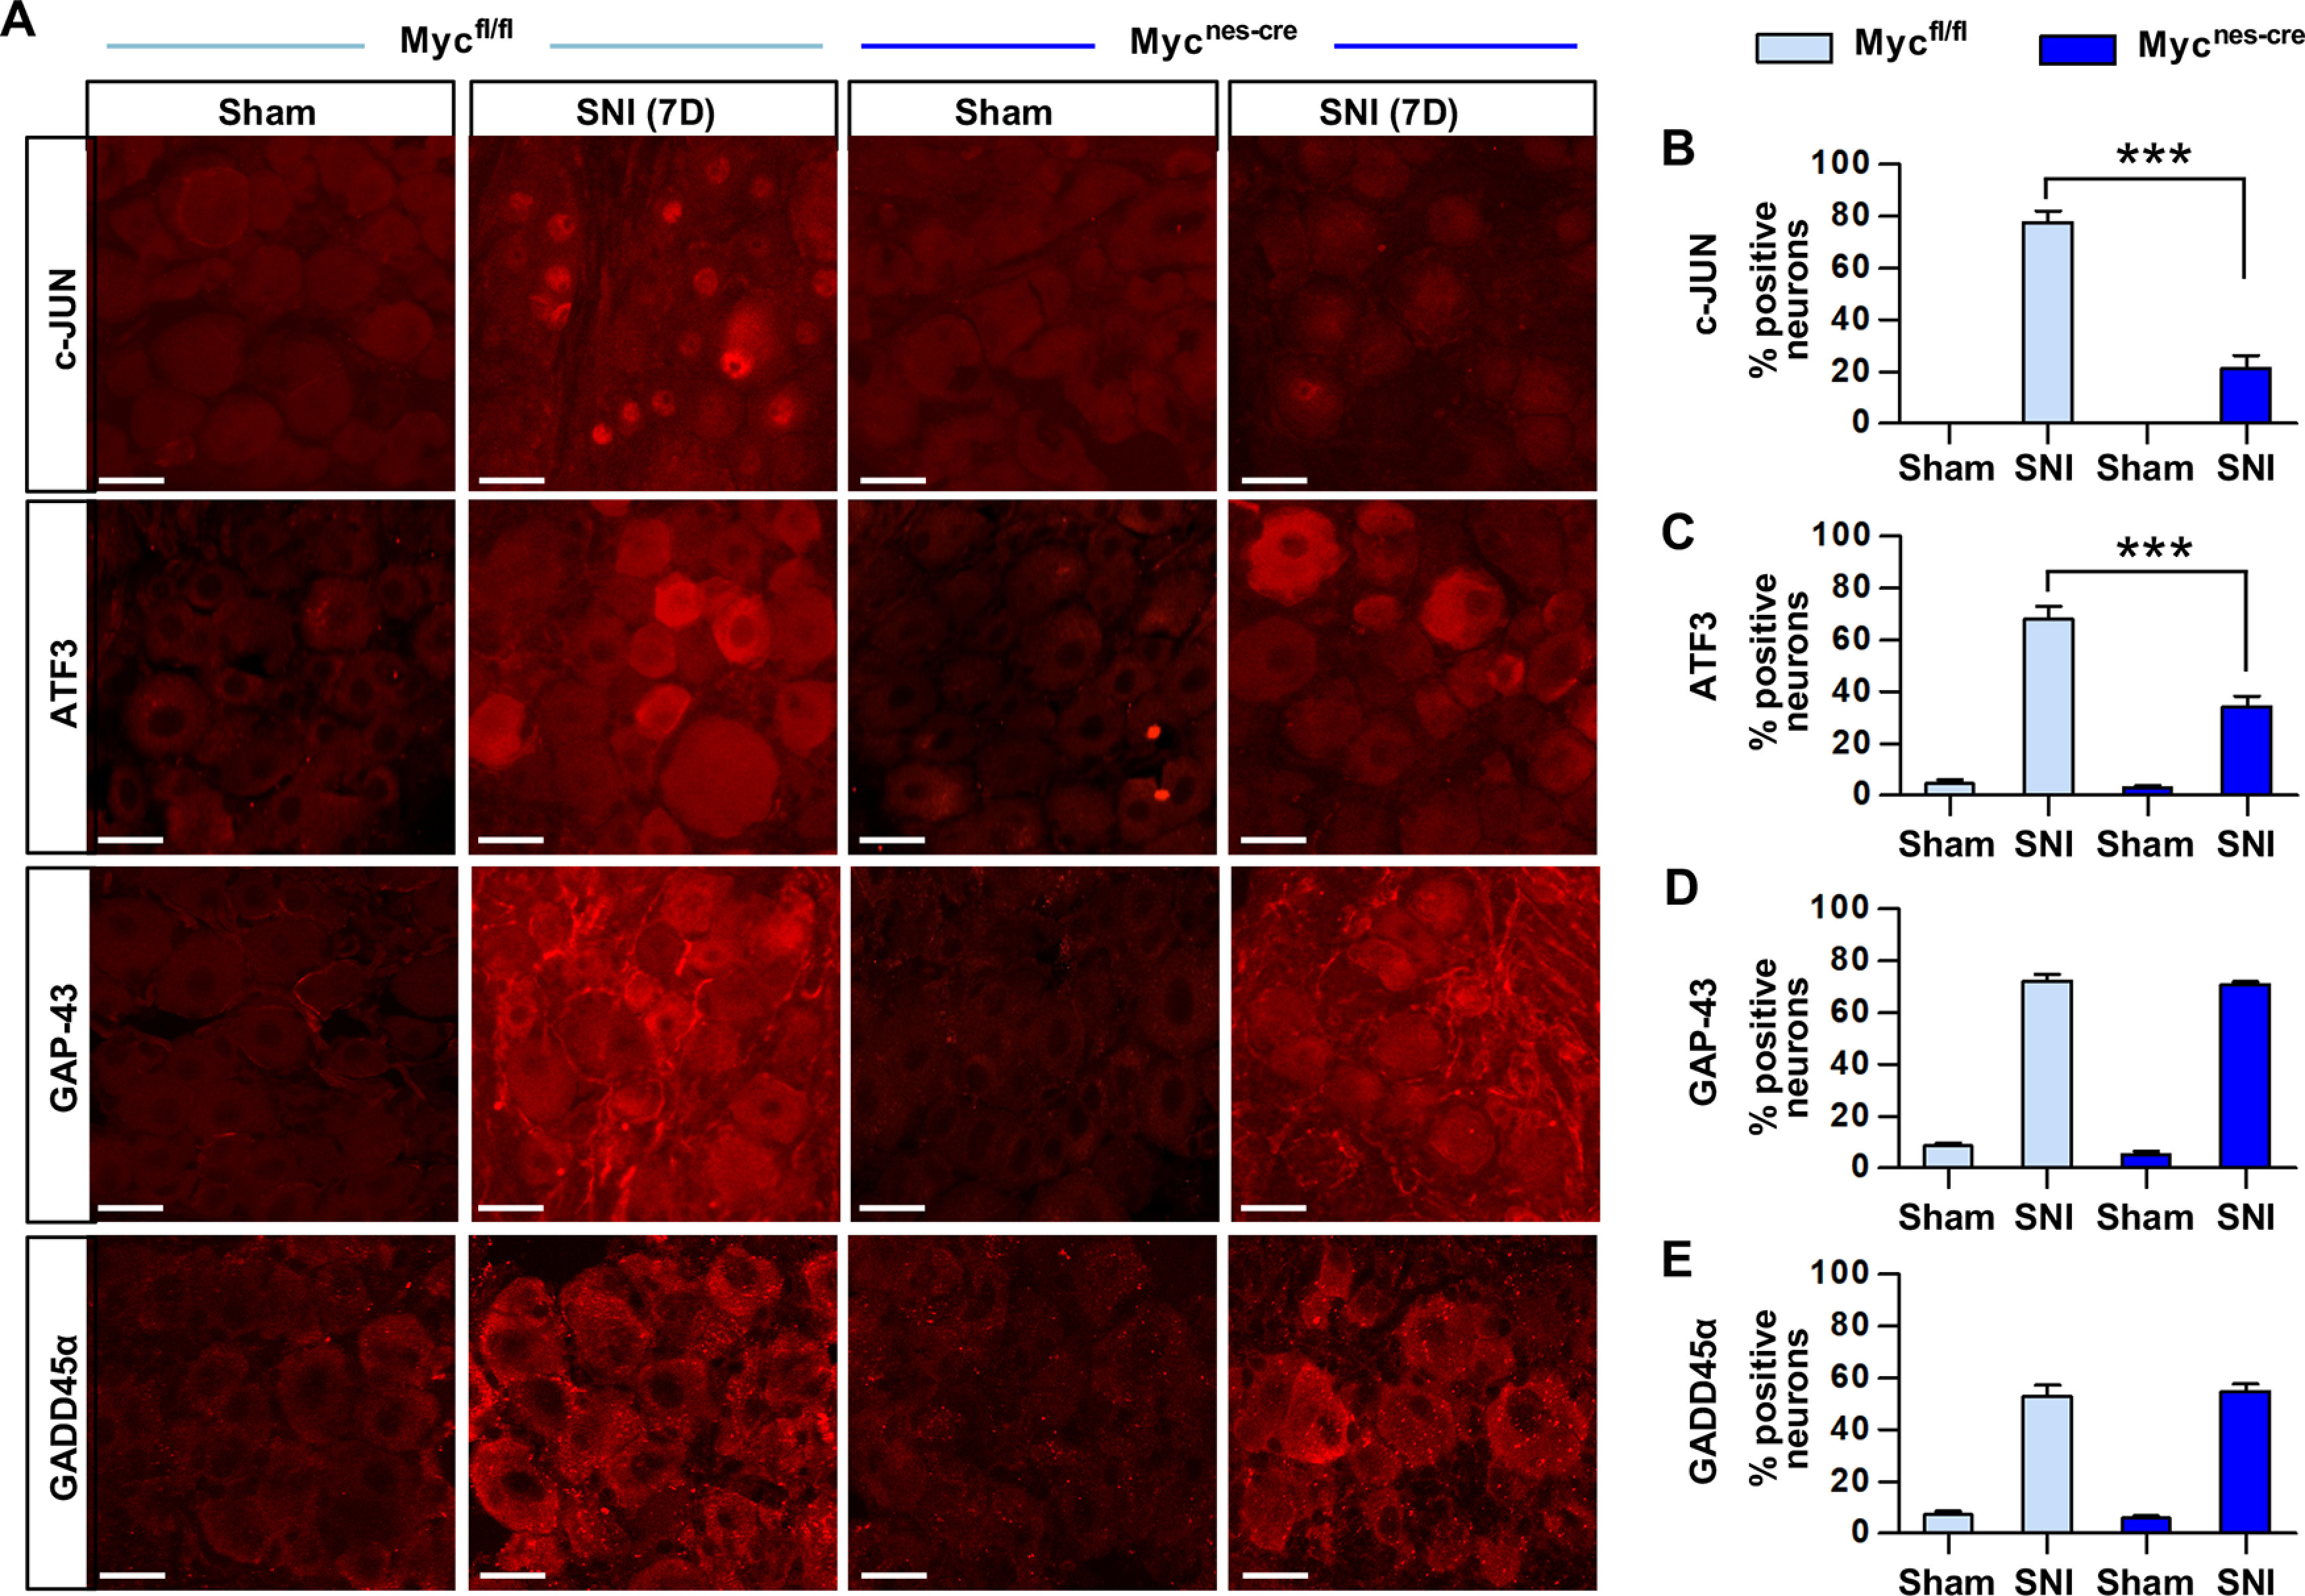
Figure 4.

Protein expression of the RAGs in Myc-deficient mice. A, Representative images of the immunofluorescence staining on the DRG sections obtained from the WT (Mycfl/fl) and Myc-deficient (Myc Mycnes-cre) animals. Animals were killed for the immunofluorescence staining 7 d after either sham operation or SNI. Scale bars, 50 μm. B–E, Quantification graphs of the percent DRG neurons positive with c-JUN (B), ATF3 (C), GAP-43 (D), and GADD45alpha (E). ***p < 0.001 (one-way ANOVA followed by Tukey's post hoc analysis). N = 3 animals per experimental group.
