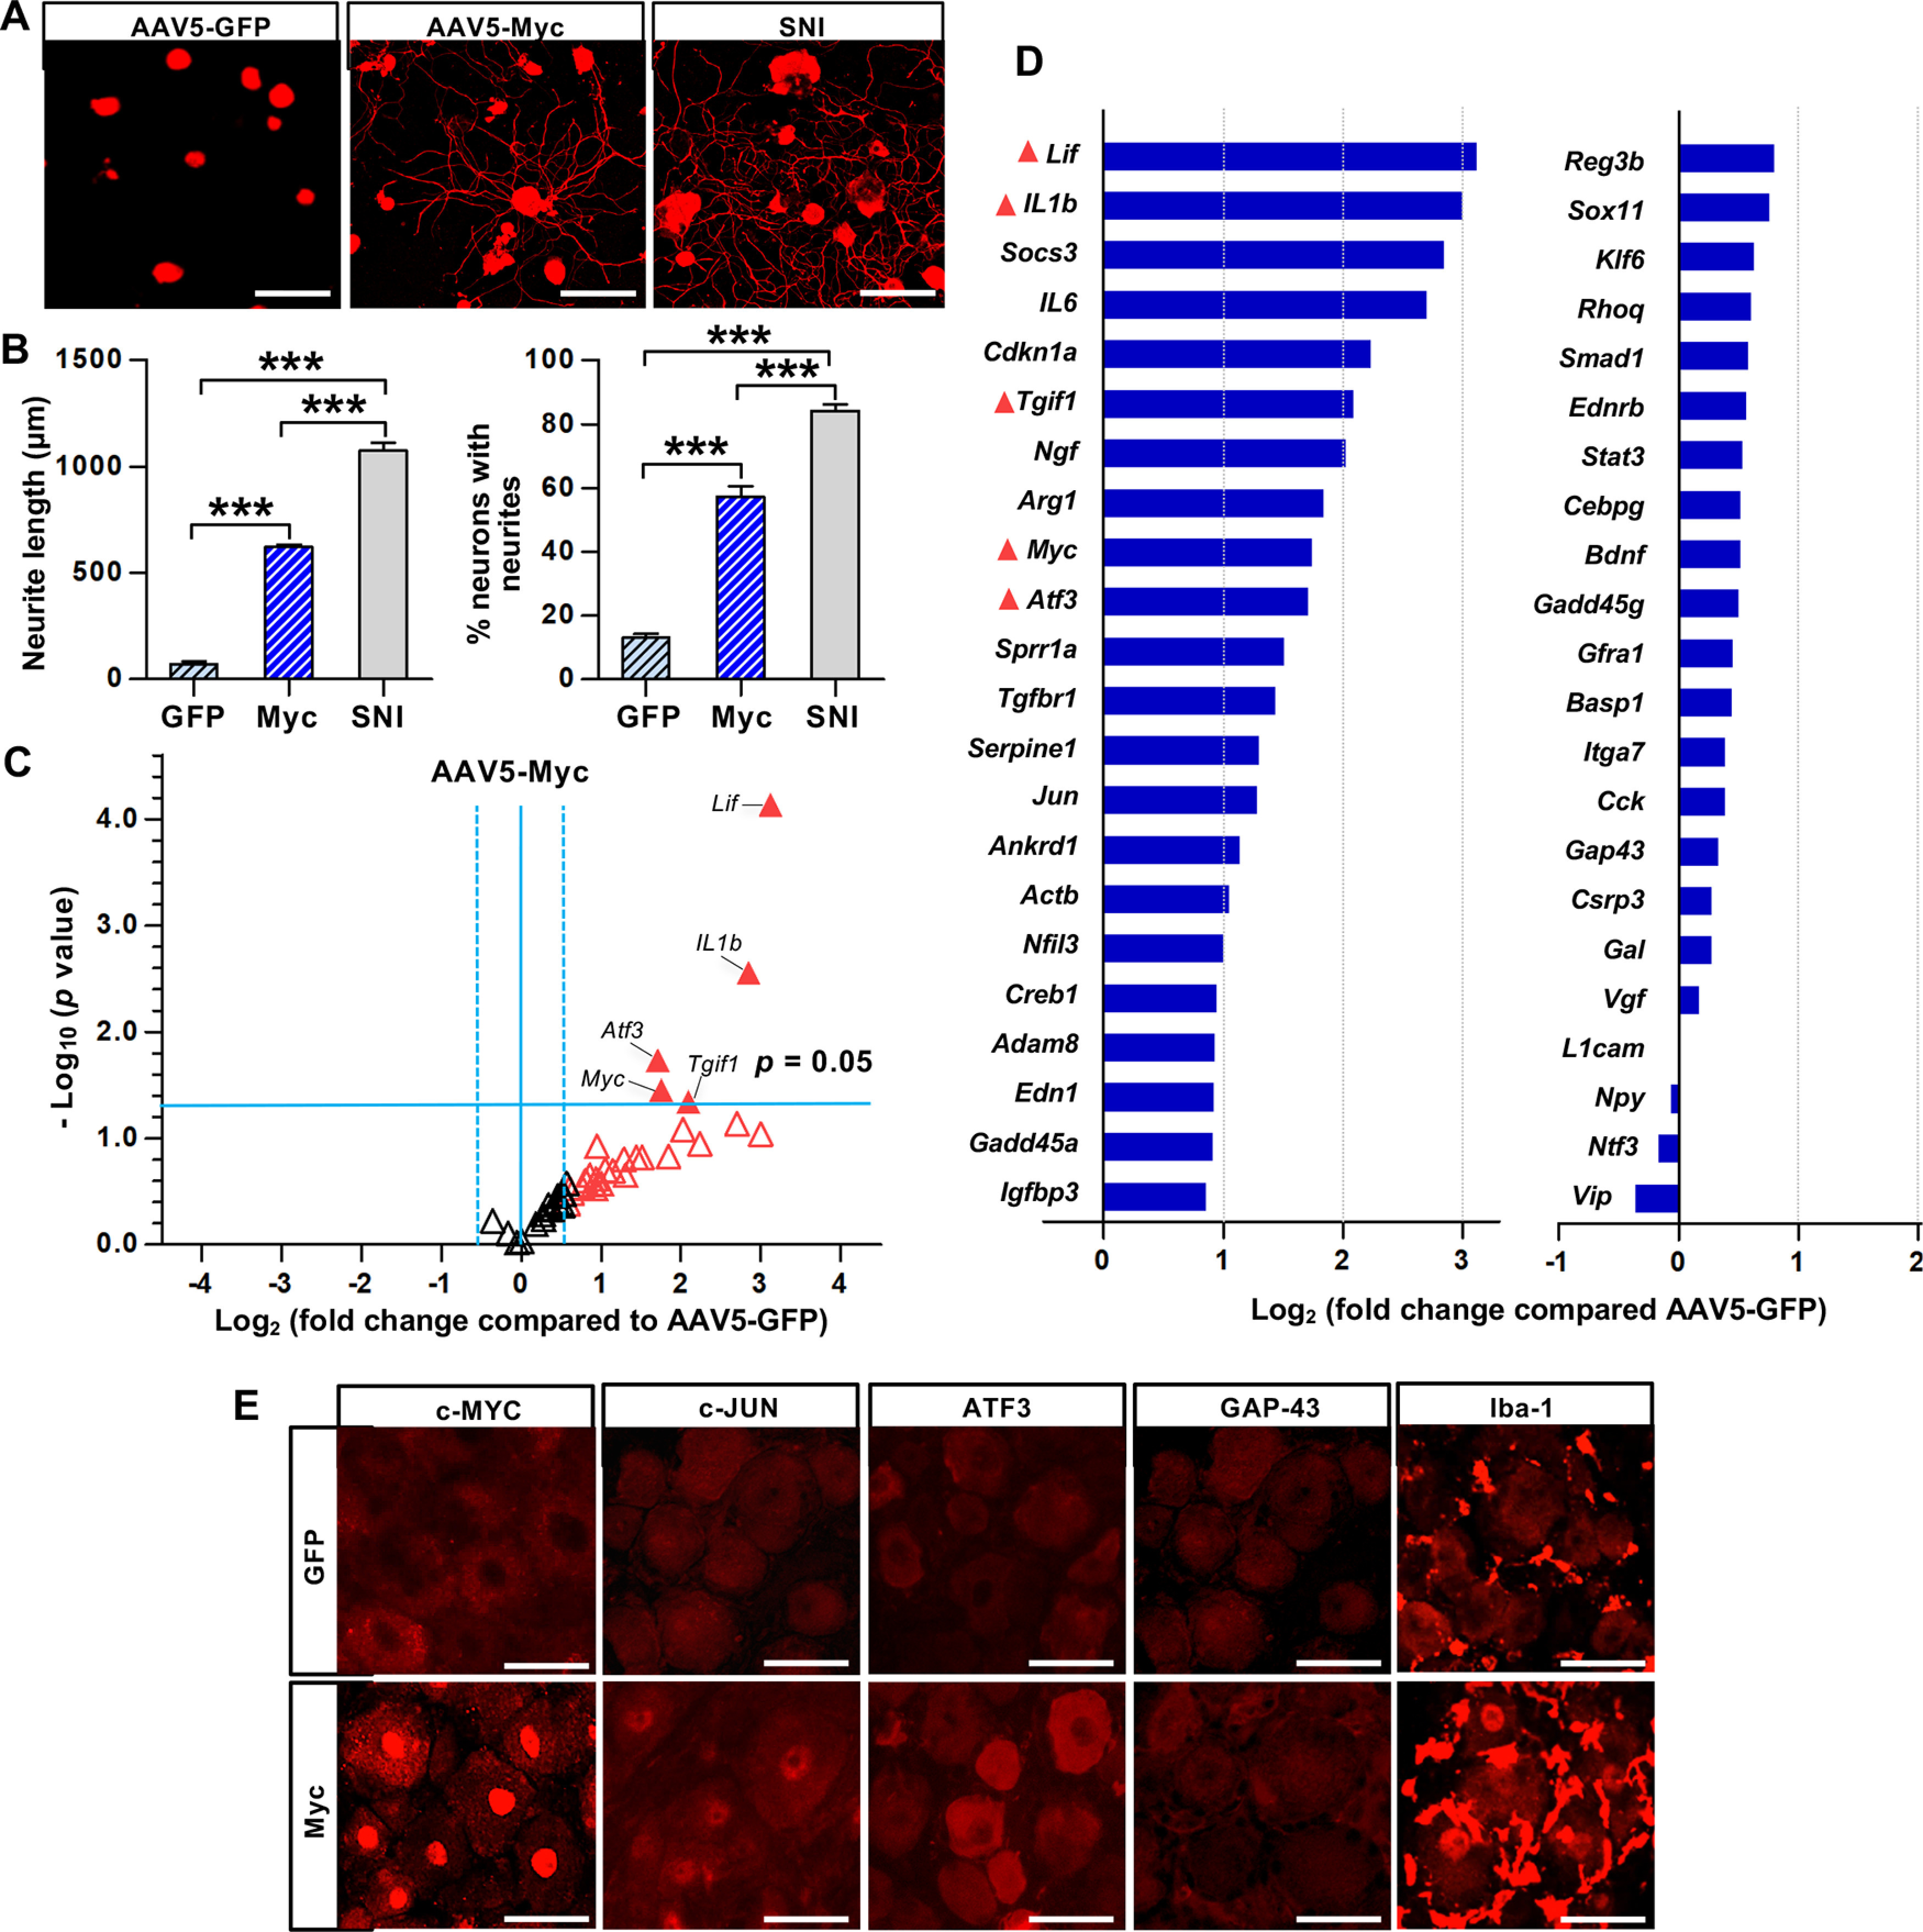
Figure 5.

Myc overexpression enhances axon growth capacity and increases expression of the RAGs. A, Representative images of cultured rat DRG neurons visualized by βIII-tubulin staining. The L5 DRGs in rats were injected with AAV5-GFP or AAV5-Myc and dissected 28 d after the injection. The L5 DRGs were dissociated and cultured for 15 h before fixation. The L5 DRGs were acutely cultured 7 d after SNI for SNI group. Scale bars, 50 μm. B, Quantification graphs of the neurite length and the percentage of neurons with neurites longer than 2 times the longest length of cell bodies. ***p < 0.001 (one-way ANOVA followed by Tukey's post hoc analysis). N = 5 animals per group. C, Volcano plots of the 44 RAG expressions in rat L5 DRGs measured using the PCR array comparing the animals with AAV5-Myc and AAV5-GFP injections. The L5 DRGs were dissected 7 d after the intraganglionic AAV injection. Dotted vertical lines indicate a 1.5-fold increase or decrease compared with the AAV5-GFP control group. Solid horizontal line indicates p = 0.05, comparing the animals with AAV5-Myc and AAV5-GFP injections (unpaired t test). Red triangles represent the genes revealing a >1.5-fold increase in expression by AAV5-Myc injection. Filled triangles represent the genes of which changes in expression by Myc overexpression were statistically significant (p < 0.05). N = 3 biological replicates per experimental group. D, Quantification graph of the 44 RAG expression levels by AAV5-Myc injection (expressed as fold changes compared with AAV5-GFP). The symbols preceding the gene titles are matched with those designated in the volcano plots (C). E, Representative images of the immunofluorescence staining on the DRG sections obtained from animals injected with AAV5-GFP or AAV5-Myc injection. Animals were killed for the immunofluorescence staining 28 d after the AAV injection. Scale bars, 50 μm.
