Figure 8.

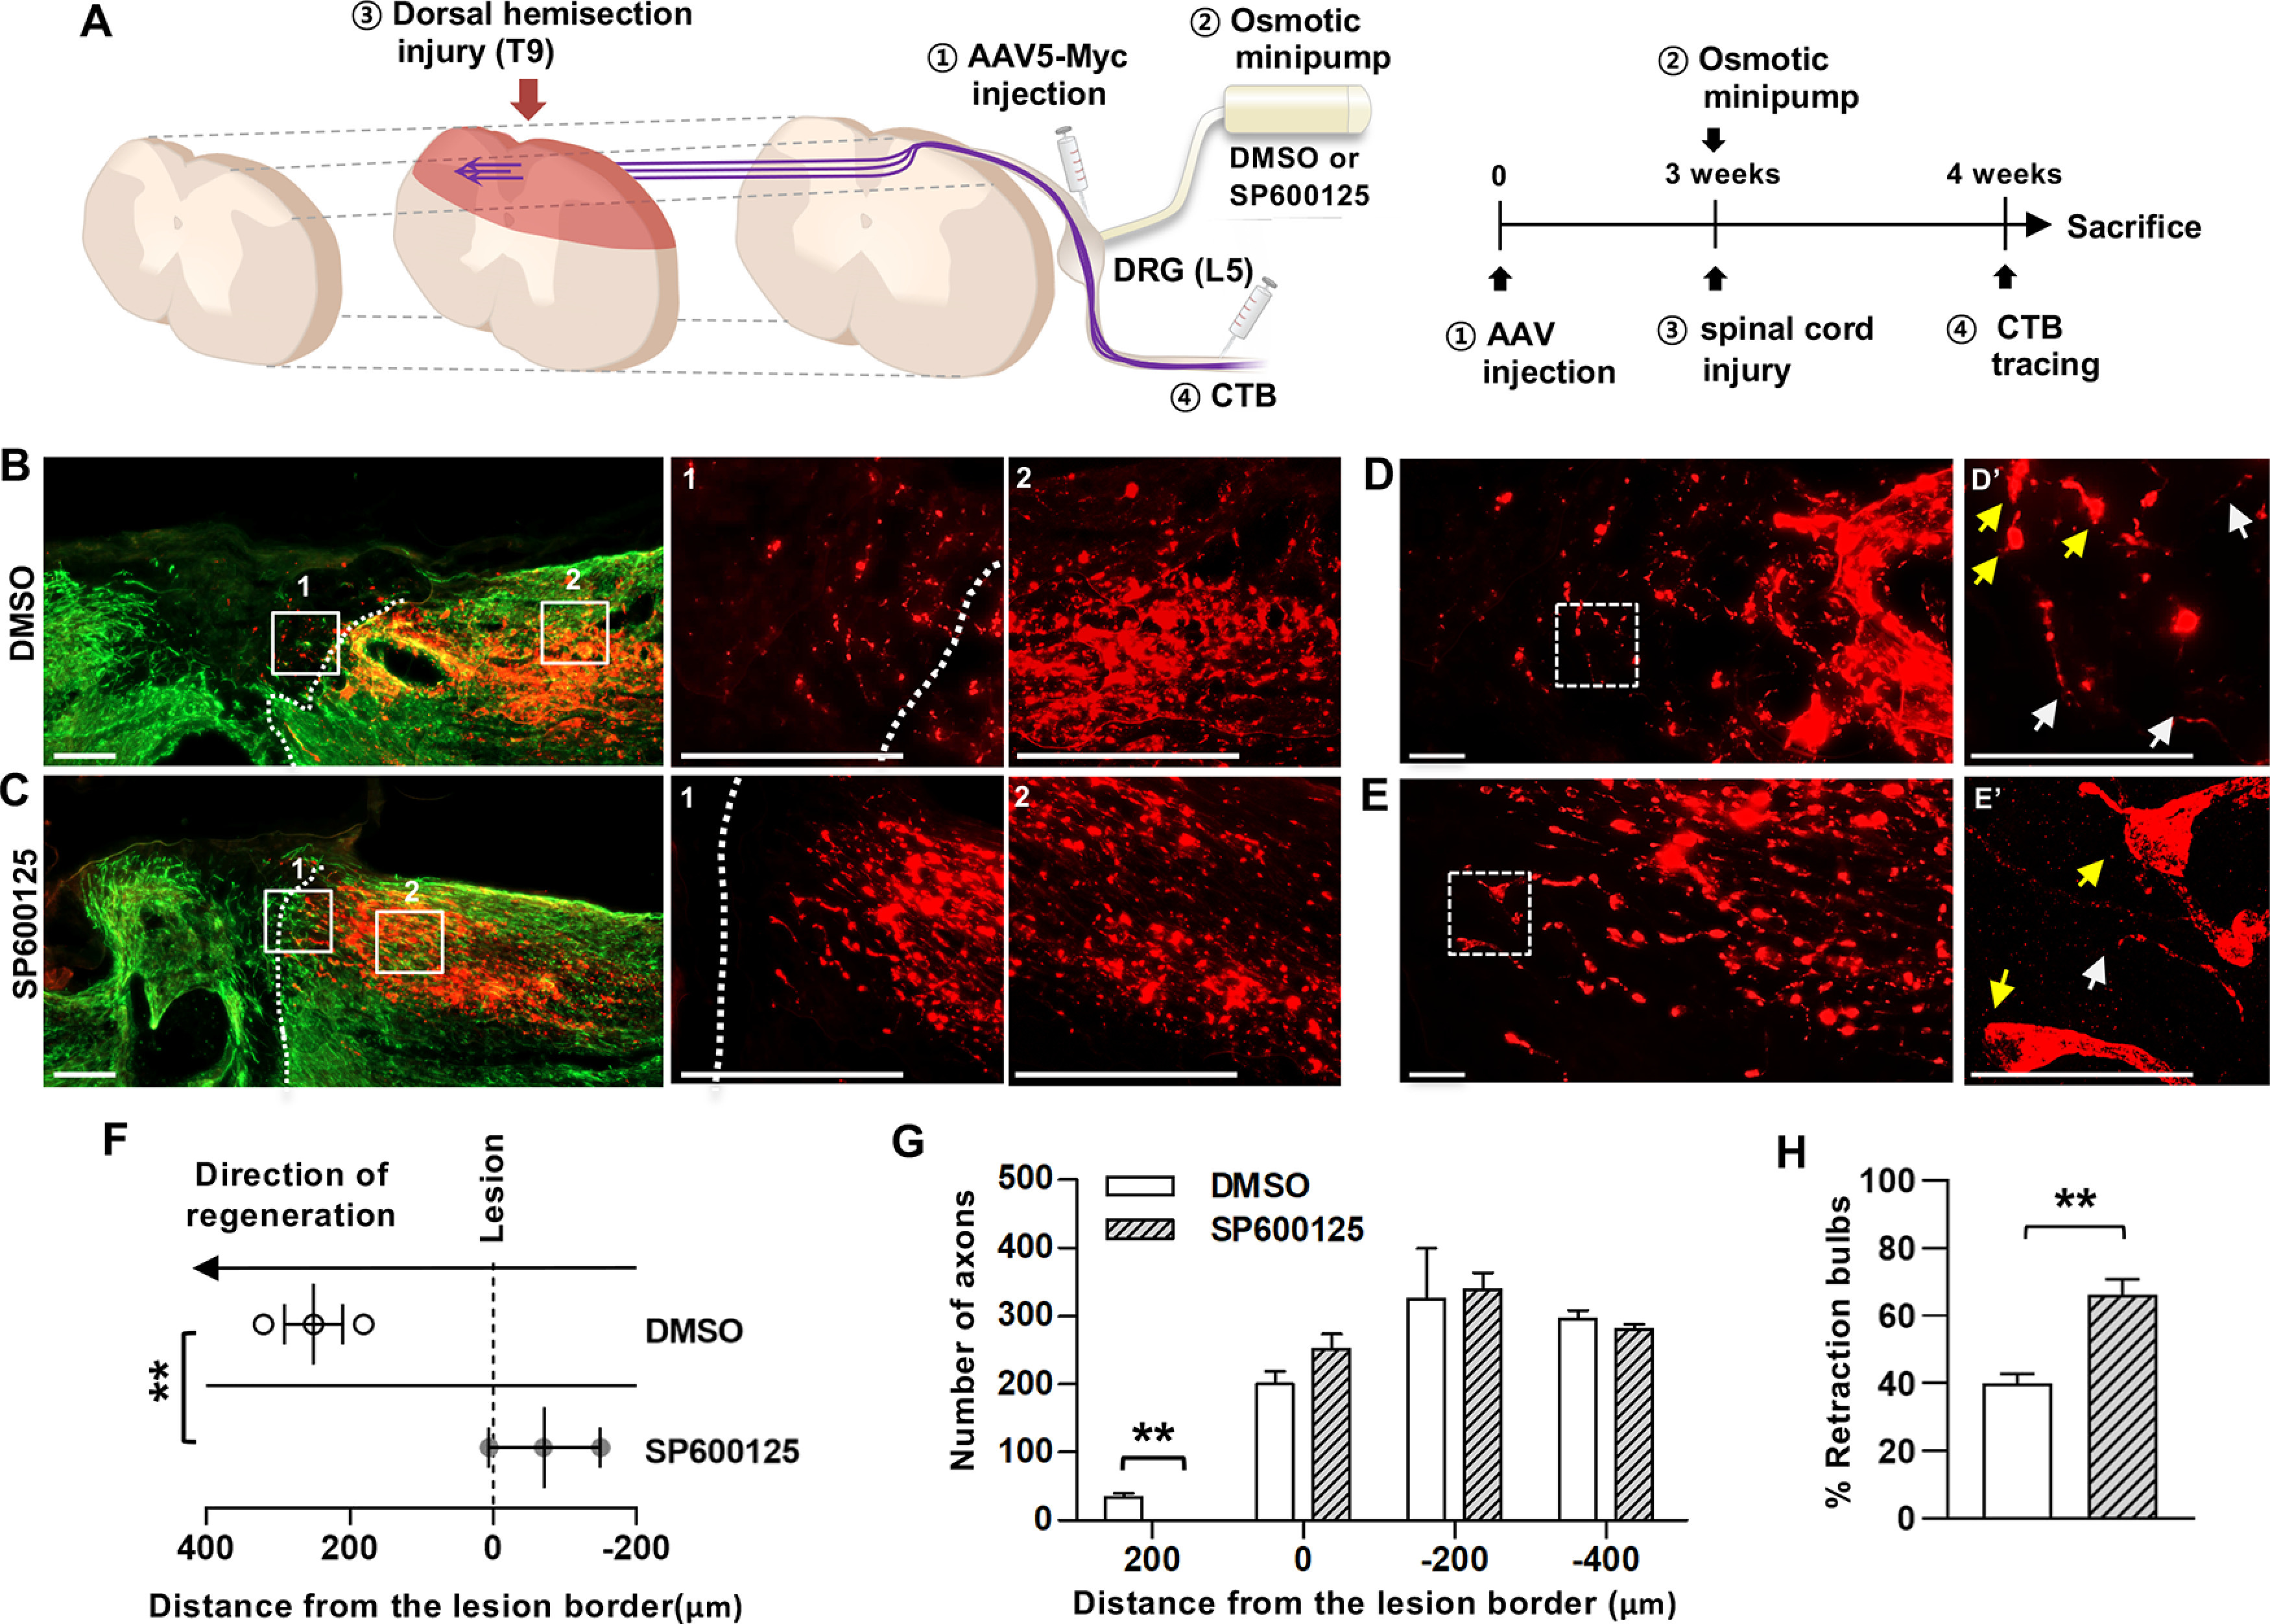
Suppression of Myc overexpression effects by JNK inhibitor. A, An experimental scheme depicting the time course of individual processes. B, C, Representative images of the parasagittal spinal cord sections from animals injected with AAV5-Myc followed by treatment of DMSO vehicle (B) or JNK inhibitor, SP600125 (C). Red represents CTB-labeled axons. Green represents GFAP-positive glial scars. Dashed lines indicate the caudal lesion borders as determined by GFAP immunostaining. B, C, Boxed regions are magnified at the right with the corresponding numbers. Scale bars: B, C, 200 µm. D, E, Morphology of the axonal tips at the axon front. D, E, Boxed regions are magnified at the right (D′-E′). Yellow arrows indicate the axonal tips counted as the retraction bulbs. White arrows indicate the axonal tips of growth-cone like morphology. Scale bars: E–G, 50 µm. F, Quantification graph comparing the longest distance of regenerating axons from the caudal lesion border. Individual circles plot the longest distance of each animal. Negative values indicate the degree of the retraction from the lesion border. G, Quantification graph comparing the number of CTB-positive axons within counting blocks located at different distances from the lesion border. The numbers in the x axis indicate the distance of the rostral border of a counting block from the lesion border. H, Quantification graph comparing the percentage of retraction bulbs. The retraction bulbs were defined as the axons with ration between the maximum tip diameter and the axon cylindrical diameter ≥4.0. **p < 0.01 between animals (one-way ANOVA followed by Tukey's post hoc analysis). N = 3 for each group.
