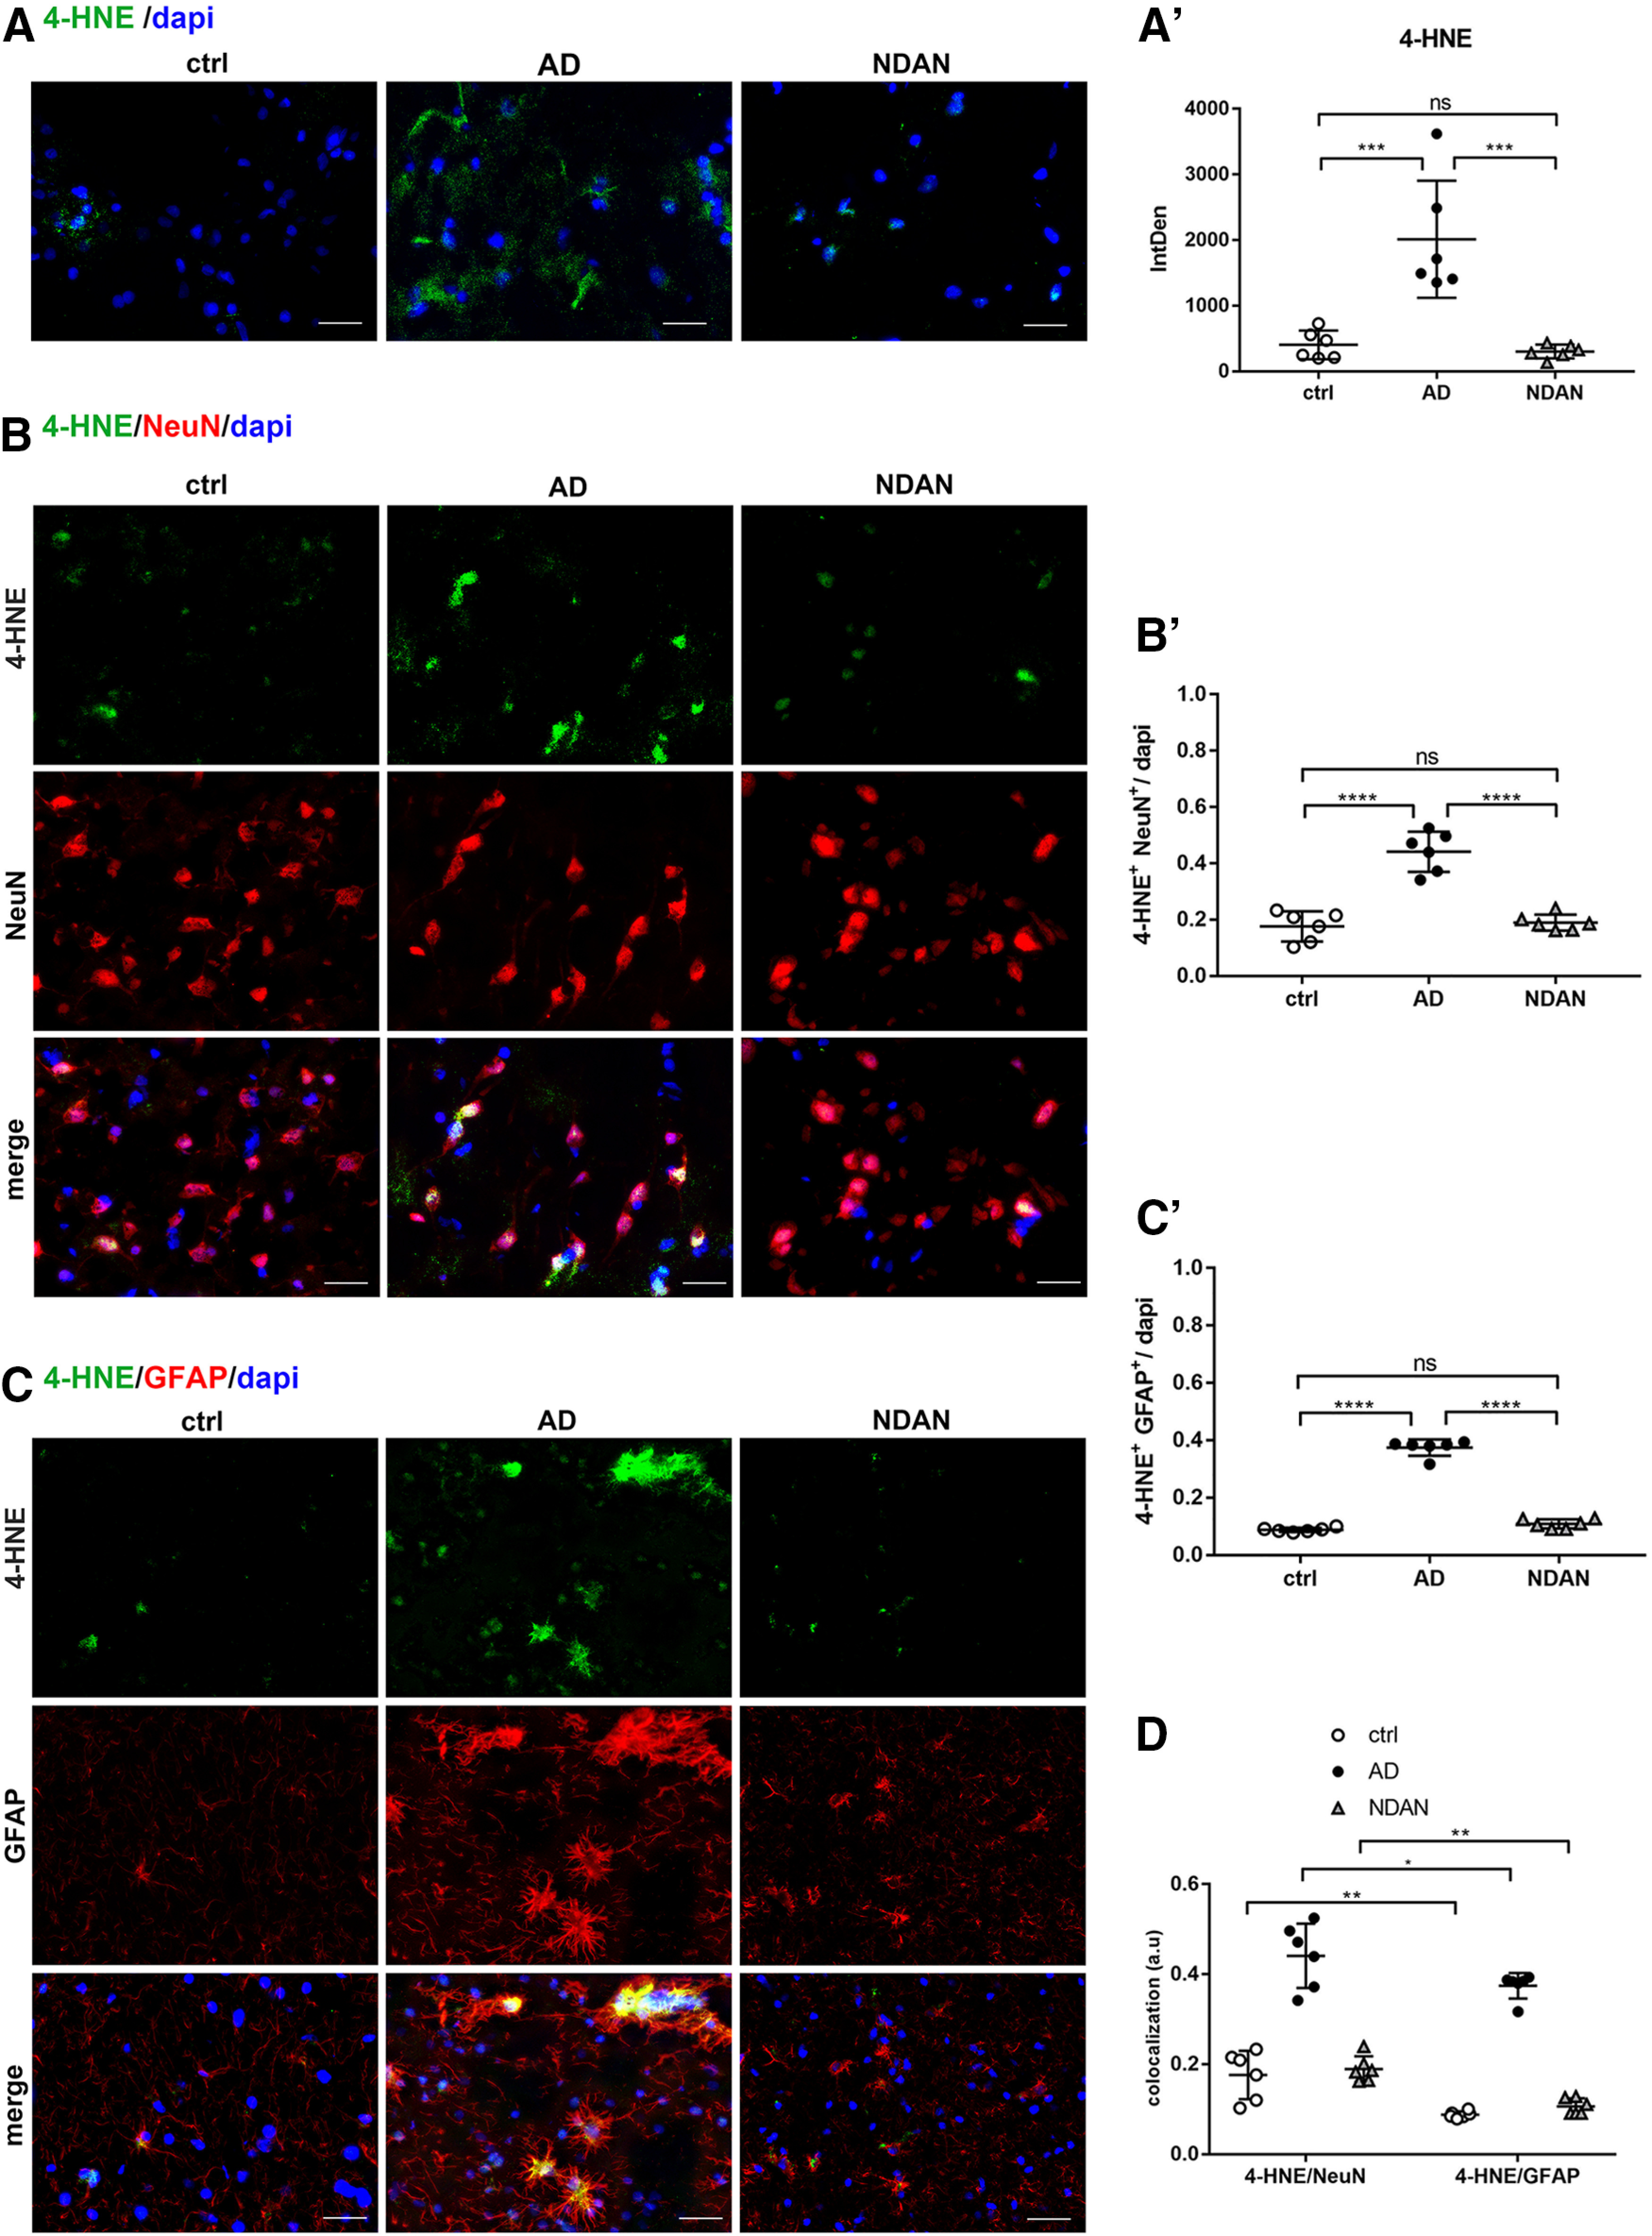
Figure 4.

A, A′, 4-HNE expression and distribution in frontal cortex of control, AD, and NDAN subjects. Immunolocalization of 4-HNE and quantitative analysis of IF images showing increased levels of the lipid peroxidation marker in AD brains and low levels in NDAN subjects, compared with control subjects. Original magnification, 60×. Scale bar, 30 µm. Statistical analyses were made using one-way ANOVA (F(2,15) = 19.44, p < 0.0001) following Tukey's test multiple-comparisons test. Values are expressed as the mean ± SD. ***p < 0.001. B–D, 4-HNE expression and distribution in frontal cortex neurons and astrocytes of control, AD, and NDAN subjects. B, B′, Double IF of 4-HNE (green) in combination with NeuN (red) shows high levels of oxidative damage in AD neurons. NDAN neurons demonstrate low levels of lipid peroxidation marker. Magnification, 60×. Scale bar, 30 µm. The quantitative analysis of IF images shows a significantly higher levels of oxidative damage marker in AD neurons. Statistical analyses were made using one-way ANOVA (F(2,15) = 45.43, p < 0.0001) following Tukey's test multiple-comparisons test. Values are expressed as the mean ± SD. ****p < 0.0001. C, Double IF of 4-HNE (green) in combination with GFAP (red) showing high levels of oxidative damage to astrocytes in AD subjects compared with control and NDAN subjects, although less than in neurons. Magnification, 60×. Scale bar, 30 µm. C′, The quantitative analysis of IF images shows a significantly higher levels of the oxidative damage marker in AD, while NDAN and control astrocytes displayed comparable levels of damage. Statistical analyses were made using one-way ANOVA (F(2,15) = 407.9, p < 0.0001) following Tukey's test multiple-comparisons test. Values are expressed as the mean ± SD. ****p < 0.0001. D, The analysis demonstrates the significant slightly higher distribution of lipid peroxidation end product in AD neurons versus astrocytes, and the relatively higher resistance of astrocytes to oxidative damage in NDAN. Statistical analyses were made using two-way ANOVA (F(2,30) = 172.5, p < 0.0001). Values are expressed as the mean ± SD. *p < 0.05; ** p < 0.01. ns, not significant.
