Figure 7.

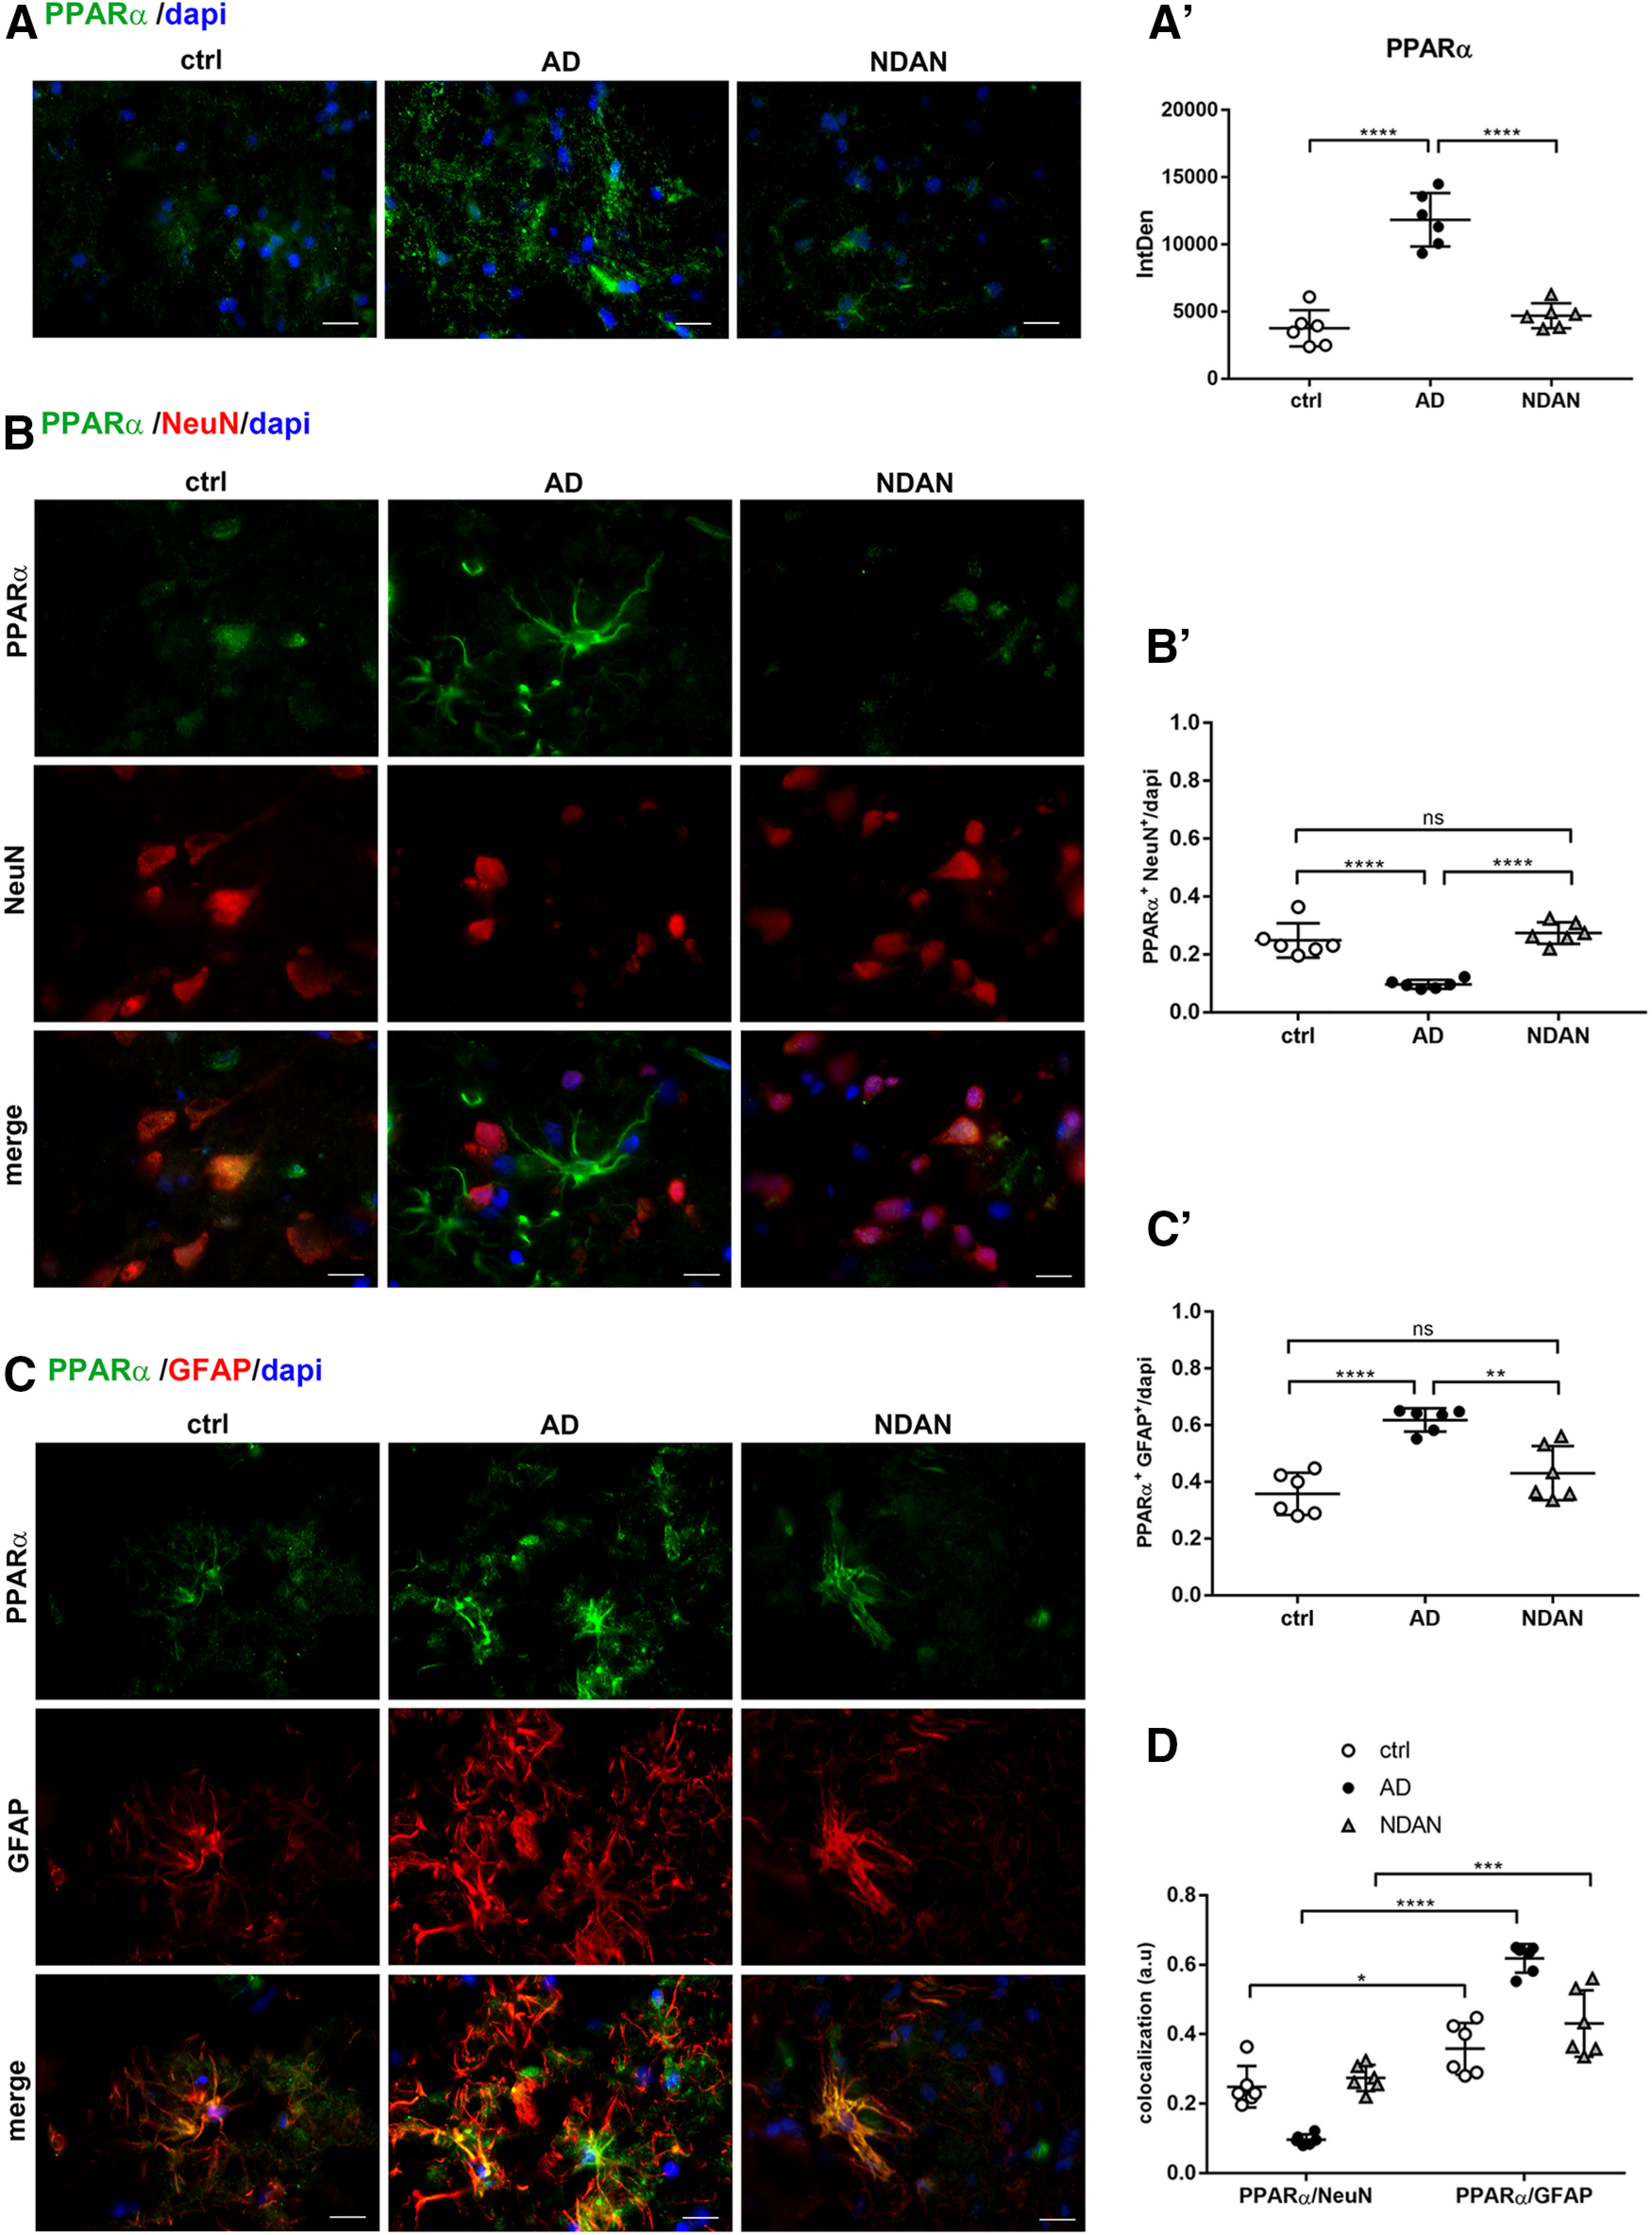
A, A′, PPARα expression in frontal cortex of control, AD, and NDAN subjects. The quantitative analyses of the IF images showing upregulation of PPARα in AD compared with control subjects. NDAN and control subjects show comparable levels of the nuclear receptor. Magnification, 60×. Scale bar, 30 µm. Statistical analyses were made using one-way ANOVA (F(2,15) = 52.78, p < 0.0001) following Tukey's test multiple-comparisons test. Values are expressed as the mean ± SD. ****p < 0.0001. B–D, PPARα expression and distribution in frontal cortex neurons and astrocytes of control, AD, and NDAN subjects. B, B′, Double IF of PPARα (green) in combination with NeuN (red) showing significant downregulation of the nuclear receptor in AD neurons. Magnification, 60×. Scale bar, 30 µm. Quantitative analysis of IF images showing a similar neuronal localization of PPARα in NDAN compared with AD subjects. Statistical analyses were made using one-way ANOVA (F(2,15) = 31.94, p < 0.0001) following Tukey's test multiple-comparisons test. Values are expressed as the mean ± SD. ****p < 0.0001. C, C′, Double IF of PPARα (green) in combination with GFAP (red) and quantitative analysis showing a predominant localization of the nuclear receptor in AD astrocytes, while NDAN and control astrocytes display comparable levels of PPARα. Magnification, 60×. Scale bar, 30 µm. Statistical analyses were made using one-way ANOVA (F(2,15) = 19.85, p < 0.0001) following Tukey's test multiple-comparisons test. Values are expressed as the mean ± SD. **p < 0.01; ****p < 0.0001. D, The analysis shows the significant upregulation of PPARα in AD astrocytes. NDAN and control subjects display comparable levels of PPARα in both neurons and astrocytes. Statistical analyses were made using two-way ANOVA (F(2,30) = 42.54, p < 0.0001). Values are expressed as the mean ± SD. *p < 0.05; ***p < 0.001; ****p < 0.0001. ns, not significant.
