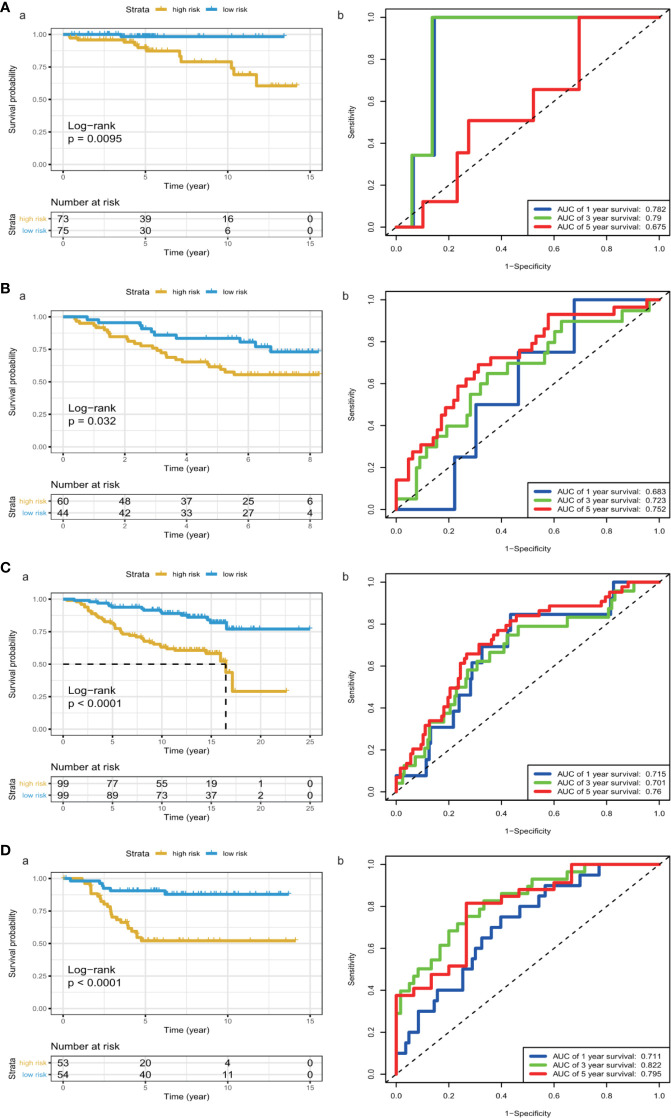
Figure 4.
KM survival analysis and time-dependent ROC curves in the ICGC and GEO cohorts. (A) (ICGC), (B) a (GSE42568), (C) a (GSE7390), (D) a (GSE58812), Kaplan–Meier analysis with two-sided log-rank test was performed to estimate the differences in OS between the low-risk and high-risk group patients. (A) b (ICGC), (B) b (GSE42568), (C) b (GSE7390), (D) b (GSE58812), 1-, 3- and 5-year ROC curves of the 8-GRG signature were used to demonstrate the sensitivity and specificity in predicting the OS of BC patients.

