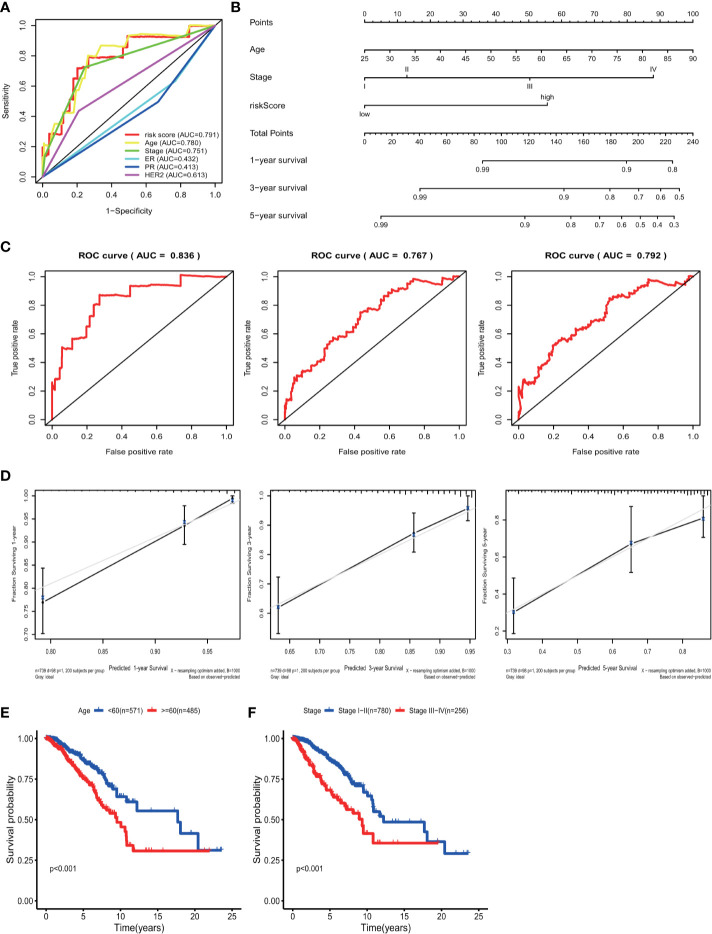
Figure 5.
ROC curve with respect to clinical features and risk model, nomogram and Kaplan–Meier survival analysis for BC patients with clinical features: (A) Time-dependent ROC curve with respect to single clinical features and risk model. (B) The nomogram for predicting probabilities of BC patients overall survival. (C) 1-, 3- and 5-year ROC curves for the nomogram. (D) The 1-, 3- and 5-year nomogram calibration curves, respectively. Kaplan–Meier survival analysis for BC patients with different clinical features that can predict patient survival (E, Age, F, Stage).

