
Fig. 5. Cellular dynamics of patient fibroblasts.
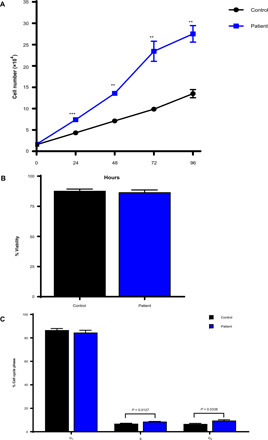
(A) Five H3F3A/B patient fibroblast lines (H3F3B: p.G34V; H3F3A: p.R17G; H3F3A: p.G90R; H3F3A: p.T45I; and H3F3B: p.V117V or p.S146X in alternate transcript) demonstrated increased proliferation over six matched controls. **P < 0.005 and ***P < 0.0005. Data represent means ± SEM of three biological replicates using three technical replicates each. (B) The same five H3F3A/B patient fibroblasts and six controls show no major differences in cell viability. The data represent the means ± SEM of four biological replicates using two technical replicates each. (C) Cell cycle analysis showed differences in the S (P = 0.0127) and G2 (P = 0.0338) phase in the same five patient cell line compared to the six control fibroblast lines. Data represent the means ± SEM of four biological replicates using two technical replicates each.