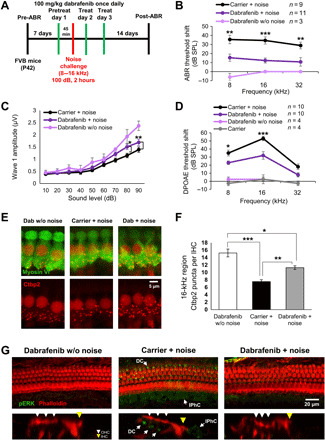
Fig. 5. Dabrafenib pretreatment protects against noise-induced hearing loss in adult mice.

(A) Schedule of administration of dabrafenib and noise exposure to adult P42 FVB mice. (B) ABR threshold shifts following protocol from (A). Dabrafenib treatment without noise exposure (light purple), noise alone (black), and dabrafenib treatment with noise exposure (dark purple). (C) Amplitudes of ABR wave 1 at 16 kHz from (B). (D) DPOAE threshold shifts following protocol from (A). Carrier without noise exposure (gray), dabrafenib treatment without noise exposure (light purple), noise alone (black), and dabrafenib treatment with noise exposure (dark purple). (B to D) Means ± SEM, *P < 0.05, **P < 0.01, ***P < 0.001 compared to noise alone by two-way ANOVA with Bonferroni post hoc test. (E) Representative Ctbp2 puncta (red)– and myosin VI (green)–stained confocal images of IHCs in whole-mount mouse cochlea at the 16-kHz region. (F) Number of Ctbp2 puncta per IHC at the 16-kHz cochlear region were counted; data shown as means ± SEM, *P < 0.05, **P < 0.01, ***P < 0.001 by one-way ANOVA with Bonferroni post hoc test. n = 4 cochlea. (G) Representative phalloidin (red) and pERK (green) immunofluorescence-stained adult FVB mice cochlea. Mice were exposed to noise following protocol from (A), then euthanized, and cochlea-fixed 3 hours after noise exposure. Ortho section below shows OHCs identified with white arrows, IHCs identified with yellow arrows, and pERK-positive DCs and IPhCs identified with labeled arrows. n = 2 cochlea.
