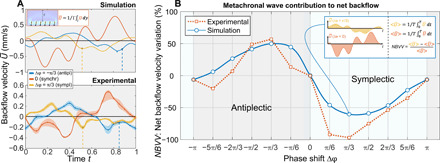
Fig. 3. Flow measurements.

(A) Backflow velocity during one cycle in the synchronous, antiplectic, and symplectic case for experiment and simulation. Dashed lines correspond to the fluid fields depicted in Fig. 4. (B) Net backflow variation for phase shifts between −π and π at fixed π/6 intervals. Values are normalized to the synchronous value of the backflow velocity. Simulation and experiment show the same sinusoidal-like trend where the extrema are at a phase shift of π/3. Negative variation occurs in symplectic waves (positive phase shifts) due to the obstructing mechanism depicted in Fig. 4 and discussed in the section Results.
