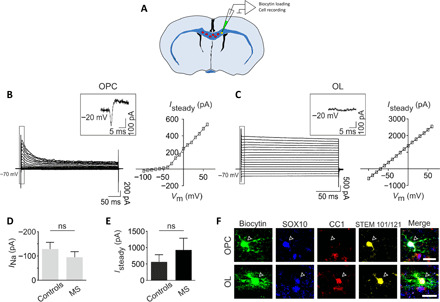
Fig. 6. Grafted MS-hiOLs show typical cell stage–specific electrophysiological properties.

(A) Schematic representation of the concomitant Biocytin loading and recording of single RFP+ hiOL derivative in an acute coronal brain slice prepared from mice engrafted with hiOLs (control or MS) and analyzed at 12 to 14 wpg. (B and C) Currents elicited by voltage steps from −100 to +60 mV in a control-oligodendrocyte progenitor (B, left) and a MS-oligodendrocyte (C, left). Note that the presence of an inward Na+ current obtained after leak subtraction in the oligodendrocyte progenitor, but not in the oligodendrocyte (insets). The steady-state I-V curve of the oligodendrocyte progenitor displays an outward rectification (B, right) while the curve of the oligodendrocyte has a linear shape (C, right). (D) Mean amplitudes of Na+ currents measured at −20 mV in control and MS iPSCs-derived oligodendrocyte progenitors (n = 8 and n = 9, respectively, for four mice per condition; P = 0.743, Mann-Whitney U test). (E). Mean amplitudes of steady-state currents measured at +20 mV in control and patient differentiated iPSC-derived oligodendrocytes (n = 10 and n = 6 for 3 and four mice, respectively; P = 0.6058, Mann-Whitney U test). (F) A control iPSC-derived oligodendrocyte progenitor loaded with biocytin and expressing OLIG2, STEM101/121, and lacking CC1 (top) and an MS iPSC–derived oligodendrocyte loaded with biocytin and expressing SOX10, CC1, and STEM101/121 (bottom). Scale bar, 20 μm.
