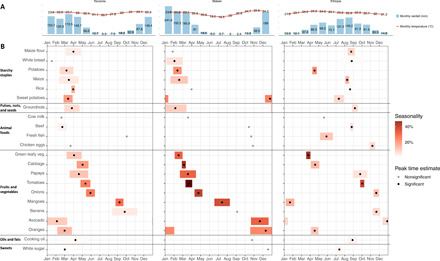
Fig. 1. Intensity and timing of seasonality in market prices for commonly consumed foods in Tanzania, Malawi, and Ethiopia.

(A) National average monthly rainfall (in millimeters) and temperature (in degrees Celsius) between 1991 and 2016 (32). (B) Ninety-five percent confidence intervals (CIs) around the peak month for each food, shown as a black dot, with the magnitude of intensity shown by the color gradation of each bar. Gray dots show the peak month for foods without statistically significant harmonic seasonality. Price variation is estimated from data in local currency units (LCUs) per item, on average over all market locations in each country shown.
