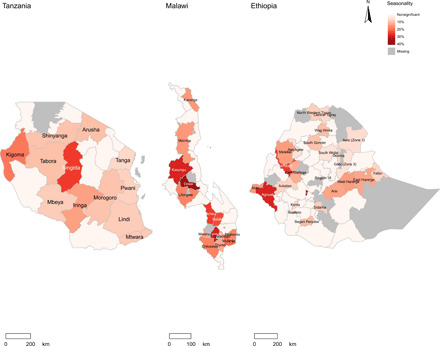
Fig. 6. Geographical distribution of seasonality in diet costs within Tanzania, Malawi, and Ethiopia.

Color gradations show the magnitude of estimated seasonal intensity in the CoNA.

Color gradations show the magnitude of estimated seasonal intensity in the CoNA.