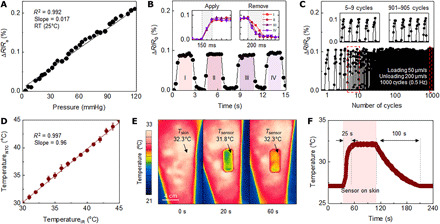
Fig. 3. Performance characteristics of a 3D pressure and temperature sensor.

(A) Fractional change in resistance of a 3D pressure sensor as a function of normal pressure loading. RT, room temperature. (B) Measurement of the temporal response of a sensor and overlaid responses during applying and removing pressure (inset). (C) Fractional change of resistance at different stages of fatigue testing with a speed of 50 and 200 μm/s (loading and unloading) over 1000 cycles. (D) Response of an NTC temperature sensor as a function of temperature of a supporting substrate measured using an IR camera. (E) IR photograph of an SCV on the leg at two time points after mounting. (F) Temperature of the SCV before and after mounting on the skin and after removal.
