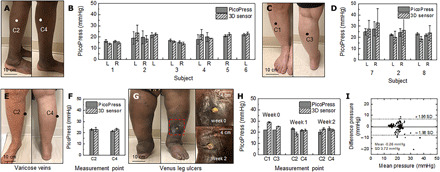
Fig. 6. Clinical studies of interface pressure measured by SCV and reference devices from eight patients with different pathologies.

Photographs of measurement locations on the leg of a patient and pressures measured by SCV and reference devices at locations C2 and C4 (A and B) and C1 and C3 (C and D) on the left (L) and right (R) legs of patients using compression stockings. Photographs of the right leg and changes in pressure of a patient with varicose veins (E and F). (G) Photographs of the left leg and the VLU of a patient and measured pressures for 2 weeks (H). (I) Bland-Altman plot comparing results from the SCV and reference devices. Photo credit: Brianna R. Kampmeier, Northwestern University.
