
Fig. 1. Model fit and parameter inference.
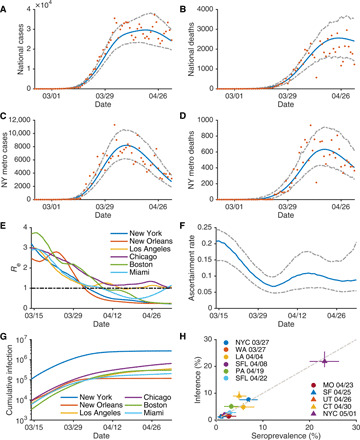
Posterior fitting to daily cases and deaths in the United States (A and B) and the New York metropolitan area (C and D). Orange dots represent observations. Blue and gray lines are the median estimate and 95% CIs, respectively. The estimated effective reproductive number, Re, in six metropolitan areas are shown in (E). The black dotted line indicates Re = 1. (F) The estimated ascertainment rate over time. The blue line and gray dashed lines are the median estimates and 95% CIs, respectively. (G) The estimated cumulative infections (both reported and unreported) in six metropolitan areas. We compare the reported seroprevalence (%) in nine locations on different dates with the inferred percentage cumulative infections on those dates in (H). Whiskers show 95% CIs. Details on the serological survey are provided in Materials and Methods.