
Fig. 3. Counterfactual simulations with control interventions beginning in early March, 1 and 2 weeks earlier than implemented.
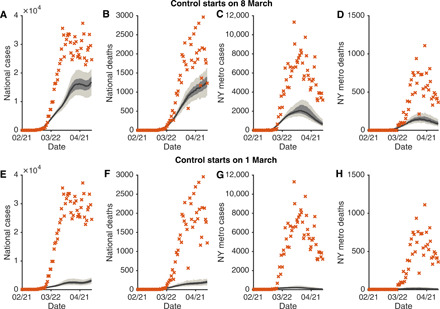
Daily cases and deaths in the United States (A, B, E, and F) and the New York metropolitan area (C, D, G, and H) under early interventions are compared with the observations (orange crosses). The top and bottom rows present counterfactuals with interventions implemented on 8 and 1 March, respectively. The black lines and surrounding bands show the median estimate, interquartile, and 95% CIs.