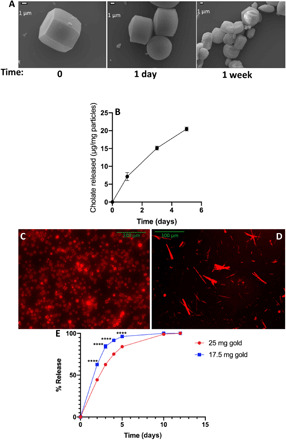
Fig. 4. Representative degradation and release kinetics of bile salt microparticles.

(A) SEM images of the surface morphology of cholate particles after incubation at 37°C for various time points. Scale bars, 1 μm. (B) Quantified amount of released cholate after incubation of bile salt particles at 37°C for different time points. Fluorescence image of rhodamine-loaded (C) cholate and (D) deoxycholate particles. (E) Release profile of rhodamine from deoxycholate composite particles fabricated in the presence of different amounts of HAuCl4. The concentration of the particles in phosphate-buffered saline (PBS) was set at 10 mg/ml. Each condition was repeated for n = 3 (error bars are smaller than 1% for all points). Two-way ANOVA was used to analyze (E), and significance for each point was calculated with respect to the corresponding condition fabricated in the presence of 25 mg of gold. ****P < 0.0001.
