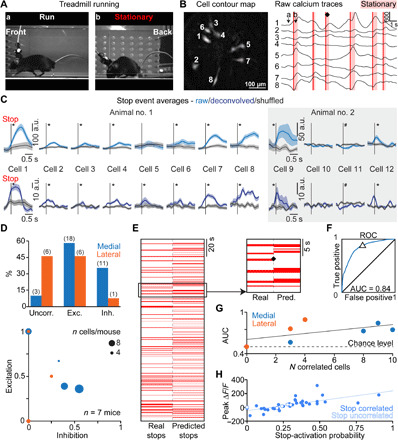
Fig. 2. Activity of V2a Gi neurons correlates with spontaneous locomotor stops during treadmill running.

Example mouse on treadmill (A) (photo credit: Joanna Schwenkgrub, CNRS). (B) Corresponding smoothed raw calcium traces (right) and cell contour map (left). Red vertical lines, stops; ♦, example stop event. (C) Associated average calcium transients at stop events are shown (left), together with another example animal (right); *, significant difference relative to time-shuffled data (gray shaded areas: SEM, P < 0.05). (D) Top: Fraction of V2a neurons uncorrelated, excited, or inhibited at stops. Distribution at lateral versus medial locations is significantly different (2 × 3 Fisher exact test, P = 0.0139). Bottom: Fraction of excited and inhibited cells per animal; dot size = number of recorded cells. (E) Real and predicted locomotion state (stationary = red bar). The magnification shows stops corresponding to traces in (B). ♦, unpredicted stop. (F) Receiver operating characteristic (ROC) for the same mouse. AUC, area under the curve. Δ = prediction performance in (E). (G) Number of cells per animal against performance of the stop classifier. Trend line in black. (H) Scatter plot of the peak ΔF/F (a.u.) for a stop versus stop-activation probability for all the visible cells (n = 39) recorded in six mice; resampling test, P < 0.05.
