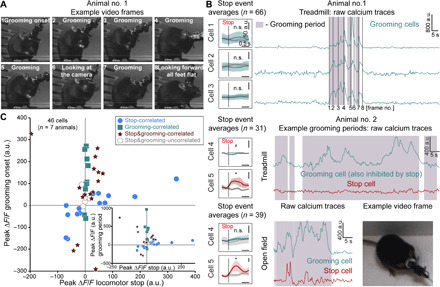
Fig. 6. A fraction of V2a neurons are active during grooming.

(A) Grooming postures (frame nos. 1 to 5 and 7) of example animal no. 1. (B) Top right panel: Calcium traces from three cells excited during grooming from the animal shown in (A). Frame numbers correspond to posture numbering from (A). Top left panel: Average of calcium transients at stop events of the same cells; n.s., nonsignificant correlation compared to time-shuffled data (P > 0.05). Bottom right panels: Calcium traces of the two example cells (grooming-correlated in turquoise, stop-correlated in red) recorded in animal no. 2 in treadmill (upper) and open-field (lower) conditions showing increased activity during grooming periods (shaded areas). Example grooming posture (lower right panel) from this animal. Bottom left panels: Stop event averages for example cells (raw data). * and # represent significant differences relative to time-shuffled data for excitation and inhibition, respectively (single shuffle averages in black, gray shaded areas represent SEM), P < 0.05. Photographs from (A) and (B) by Joanna Schwenkgrub, CNRS. (C) Scatter plot of the peak ΔF/F after grooming onset versus locomotor stops. The 46 cells included in the plot are all cells recorded in seven mice during free exploration (treadmill not engaged or open field). Inset: Scatter plot of the peak ΔF/F for a grooming period versus locomotor stops.
