

We propose a protocol for near-atomic–scale analysis of frozen water and embedded nanostructures by cryo–atom probe tomography.
Abstract
Transmission electron microscopy went through a revolution enabling routine cryo-imaging of biological and (bio)chemical systems, in liquid form. Yet, these approaches typically lack advanced analytical capabilities. Here, we used atom probe tomography to analyze frozen liquids in three dimensions with subnanometer resolution. We introduce a specimen preparation strategy using nanoporous gold. We report data on 2- to 3-μm-thick layers of ice formed from both high-purity deuterated water and a solution of 50 mM NaCl in high-purity deuterated water. The analysis of the gold-ice interface reveals a substantial increase in the solute concentrations across the interface. We explore a range of experimental parameters to show that atom probe analyses of bulk aqueous specimens come with their own challenges and discuss physical processes that produce the observed phenomena. Our study demonstrates the viability of using frozen water as a carrier for near-atomic–scale analysis of objects in solution by atom probe tomography.
INTRODUCTION
In recent decades, transmission electron microscopy (TEM) has undergone tremendous progress, in part leading to the 2017 Nobel Prize in chemistry to J. Dubochet, J. Frank, and R. Henderson for “developing cryo-electron microscopy for the high-resolution structure determination of biomolecules in solution” (1). In parallel to these cryo-TEM developments in the biological sciences, there have been developments around liquid cells for imaging nanoscale objects (2). Early studies highlighted where the core difficulties were: How to make and transfer specimens that maintained the sample’s pristine state in a completely different environment, i.e., in the vacuum of the TEM, while enabling the imaging of embedded objects. Tremendous efforts, in parallel, have established atomically resolved electron tomography that led to ground-breaking results on crystal defects (3), order/disorder transitions (4), and nucleation events (5). Albeit powerful, these approaches have limited analytical capabilities and hence cannot easily measure the specimen’s atomic-scale composition.
Atom probe tomography (APT) is a burgeoning technique that enables three-dimensional (3D) elemental mapping (6) with subnanometer resolution (7) and a chemical sensitivity potentially down to only tens of parts per million (ppm) (8). The usefulness of APT in studying wet chemical systems has been limited by the challenges inherent to the analysis of liquid media. There are ongoing efforts to push the development of “cryo-APT”—although the term is slightly inappropriate as all APT experiments are performed at cryogenic temperature, typically at 20 to 80 K. The development of cryo-approaches for specimen preparation and specimen transfer (9–11) has enabled the analysis of limited volumes of frozen water (12–14) sandwiched between a needle-shaped metallic specimen and graphene sheets (15), akin to liquid cells for TEM (2). To pave the way toward studying large volumes of frozen water, strategies for specimen preparation and systematic studies are necessary to enable a precise analysis and, hence, an assessment of the performance limits of cryo-APT. This could unlock a more widespread application of APT to study individual molecules—a pioneer of the technique once referred to this as a “chimera” (16), i.e., an unachievable dream. There are sporadic reports of using APT for investigating molecular and biological materials (17–23) and for the characterization of nanoscale objects, i.e., nanoparticles (24, 25), nanowires (26, 27), or nanosheets (28). However, these samples are always taken out of their native or in operando environments and dedicated strategies had to be developed to enable specimen preparation (29–31).
The analysis of “bulk” ice, similar to that performed on a metal, is yet to be carried out. The importance of water, in its numerous physical states, is not limited to the fields of physics and chemistry. It is also relevant to fields such as biology (21), atmosphere chemistry (32), geophysics (33), and even space studies (34). The low electrical conductivity of bulk ice caused the failure of analyzing a layer of ice that is tens of micrometers in thickness (35). Recent notable attempts showed the possibility of analyzing hydrated glass by APT (10).
Here, we report on the analysis of micrometer-thick layers of frozen water formed on nanoporous gold (NPG). NPG is formed by the selective dissolution of Ag from a AgAu solid solution in acidic conditions, causing the formation of a 3D bicontinuous open-pore nanostructure (36). NPG has found application in catalysis, electrochemical sensing, and actuation, owing to a high surface area–to–volume ratio and Au-rich surfaces. In this work, we take advantage of NPG as a hydrophilic substrate to analyze ice by APT. NPG typically exhibits hydrophilic behavior, and wetting increases with decreasing pore size (37).
To prepare specimens suitable for field evaporation within a state-of-the-art atom probe microscope, we adapted the blotting and plunge-freezing approaches typically implemented for cryo-TEM. We used an in situ plasma focused ion beam (PFIB) (38) approach, albeit here at cryo-temperature. The low contact angle of the water droplet on the NPG substrate facilitated the preparation of stable specimens fully composed of frozen liquid. The complex and continuous network of pores also provided strength to the ice-substrate interface. We report on a wide range of pulsed-laser atom probe data from pure deuterated water (D2O) and a D2O-based solution of 50 mM NaCl, obtained by systematically sweeping through some of the main pertinent experimental parameters. We also demonstrate the ability to characterize small metallic objects floating in solution and the ice-solid interface by analyzing data captured at the ice-NPG interfaces. We also discuss aspects of the physics of field evaporation that led to the detection of sets of molecular ions and their influence on the performance of cryo-APT. Our study is a necessary step toward opening a new playing field for near-atomic–scale analysis of solute effects in confined freezing, nano-objects, and molecular or biological materials in their native environment.
RESULTS
Specimen preparation
APT requires the needle-shaped specimens to produce an electrostatic field sufficiently intense to provoke field evaporation of atoms on the surface. With the availability of PFIB, an in situ APT specimen preparation strategy was revisited recently (38, 39), in which specimens were fabricated directly from the original flat sample prepared for scanning electron microscopy (SEM) imaging, eliminating the need for conventional liftout and Pt-welding procedures (40). The details of each step are described in Methods. In short, fig. S1 shows how the NPG substrate was mounted for imaging and preparation on a typical atom probe specimen holder. This holder was plunged into a liquid nitrogen bath (fig. S2). Here, we used heavy water-based, i.e., deuterated, solutions. This is a common approach to help distinguish hydrogen originating from the specimen and spurious hydrogen in the residual gas of the ultrahigh vacuum (UHV) analysis chamber of the atom probe (41–45). Most of the hydrogen from within the frozen liquids will be deuterium, while the residual gas will mostly be hydrogen.
The low contact angle of the water droplet on the NPG substrate facilitated the preparation of stable specimens comprising the frozen liquid and the metallic interface. The cross-sectional image of the interface structure of ice-on-NPG (fig. S3) shows that there are no noticeable voids along the interface or within NPG substrate. The successive steps of specimen preparation are outlined in Fig. 1 (and fig. S4 for another specimen). A trench is made to provide a path for the laser beam, and annular patterns with successively decreasing inner diameters allow for shaping the specimen. Several specimens were prepared to analyze the ice at different distances from the NPG layer. The difficulties associated with ion milling of large volumes of ice were mitigated in these experiments by aiming at the substrate edges, where the thickness of the ice layer is at its minimum, because of the wettability of NPG.
Fig. 1. SEM images of in situ APT specimen preparation of an ice sample on NPG.

(A) The 200- and 75-μm ion beam annular patterns for outer and inner diameters, respectively, were made on the ice/NPG sample. (B) The ice/NPG pillar was milled until the height of the Au post reached <50 μm (83). (C) Ice layer was gradually sharpened along with NPG until the layer reached <5 μm in height. (D) Final APT specimen of ice on NPG.
The cooling rate of water affects the degree of its crystallinity. We cannot measure the cooling rate using our current protocol. Obtaining a fully amorphous water layer would necessitate attaining a temperature lower than water’s glass transition temperature (136 K) at a cooling rate of 106 K/s or above (46). Here, whether the ice specimen is crystalline or amorphous cannot be experimentally proven. A rough estimate of the cooling rate (table S1) indicates that the sample might have taken ~0.2 s to cool down from room temperature to 136 K, i.e., one to two orders of magnitude below ~106 K s−1 necessary for vitrification at ambient pressure. In addition, in the thicker regions of the frozen droplet, the crystalline nature of the ice was confirmed by SEM during the preparation of specimens, as grain boundaries were observed in the ice on top of the NPG (fig. S5). Amorphous ice would be necessary for the cryo-preservation of solutions and biological materials, yet quenching using liquid nitrogen likely only yields crystalline ice. Experiments using liquid ethane–propane mixture or other cryogens will be necessary in the future. Preparation in the PFIB can lead to amorphization associated with damage from the incoming energetic ions (47), although FIB damage to ice-thin sections was previously shown to be limited (48). An experimental proof of the crystallinity of the APT specimens could not be obtained—this likely requires the implementation of a correlative protocol that involves cryo-transmission–Kikuchi diffraction or cryo-TEM, in combination with cryo-APT, which is currently out of reach.
APT of ice
We managed to overcome the challenge of analyzing a relatively thick (~3 μm) layer of ice, which might appear unexpected considering the intrinsically high insulating nature of crystalline ice. Previously, the analysis of ice layers by field evaporation was limited to nanoscale thicknesses of water layers condensed on top of metallic needles, suitable for field evaporation (49) and where the electrostatic field could hence be generated. It is then no surprise that the discussion has been so far largely focused on the first contact layer between water and metals. However, very little is known about the structure of water, beyond the few first few layers (50). The electrostatic field at the surface of insulating materials analyzed by APT, for instance, MgO, was thought to be generated due to the bending of the electronic bands, combined with surface defect states that enable absorption of the laser light (51, 52). Such aspects have not been reported for thick ice layers.
Using a combination of in situ APT specimen preparation and protocols for the transfer of environmentally sensitive specimens, we repeatedly collected data displaying ice chemistry at near-atomic resolution. A summary of a dataset containing >40 million molecular ions of D2O and the associated 3D atom map is presented in fig. S6. These data were acquired without any observed microfractures at the specimen tip, as often happens with apparently fragile specimens, and instead showed a smooth evolution of the applied dc voltage over the course of the experiment. Figure S7 shows another specimen inside the atom probe during the analysis, along with the corresponding voltage curve.
Figure 2A shows a typical mass spectrum obtained from the pulsed-laser APT analysis. The general trend we observed when it comes to the detected cations was that the ice evaporates in the form of singly charged molecular ions of one to five D2O molecules. We also detected such water clusters protonated with H and D atoms interchangeably; however, fully deuterated clusters always dominated other cluster groups in abundance. The proton-donating ability of water can lead to many other protonated inorganic ions during field desorption as previously reported (53). Mass spectra for a range of analysis conditions (fig. S8) show similar features. Cluster formation is believed to be a result to ion aggregation and polymerization, before field evaporation. The formation and subsequent possible dissociation of chains of water molecules and molecular ions under the influence of an intense electric field were predicted by density functional theory (54), and our results qualitatively agree with these predictions. These aspects will be further discussed below. We used the default reconstruction protocol in the commercial software package IVAS (Integrated Visualization and Analysis Software) to build a point cloud with individual points representing individual molecular ions—the volume of each ion being the default volume of the n oxygen atoms within the respective molecular ion (0.0288 nm3).
Fig. 2. Summary of the atom probe data from a thick layer of ice.

(A) Mass spectrum of acquired APT dataset of D2O ice at 100 pJ, 200 kHz, and a detection rate of 0.5%. (B) Sectioned mass spectrum from (A) to illustrate DxH3−xO complex peaks. (C) 3D reconstruction map of D2O. Inset capture shows SEM image of the specimen.
The tomogram and scanning electron micrographs of the corresponding specimen (inset) are shown in Fig. 2C. The default reconstruction parameters were used, making the overall data scaling arbitrary, in particular considering the relatively high level of background that likely originates from molecules field-evaporated from the specimen’s surface and not accounted for in the analysis. The preanalysis scanning electron micrographs only provide an indication of the total analyzed depth. Yet, one can assume that the relative topology of the data on a local scale would map to the structure in the original specimen, although the effective spatial resolution in such a case is not precisely known (7). The length of the ice layer on top of the NPG was used as an upper bound to assess that, although arbitrary, the reconstruction would be a reasonable representation of the analyzed volume. More accurate reconstruction could be obtained from pre- and post-analysis imaging by SEM or maybe, in the future, TEM.
APT of embedded nanoscale objects and NPG-ice interface
Our preliminary work also shows the possibility of analyzing frozen liquid–metal interfaces. The dealloying process produces Ag ions within the vicinity of the nanoporous layer. Areas within the ice layer were found to contain agglomerations of Ag ions. Figure 3 shows, in blue, the mass-to-charge spectrum from a subset of a dataset obtained at low pulsing energy (20 pJ) that contains regions of high Ag content. Ag is detected as atomic ions and as singly charged, Ag-containing, molecular ions with one or more D2O molecules. A similar behavior was reported for other interfaces between a metal and frozen water (10, 55). The corresponding volume is shown in the inset. An isocomposition surface was superimposed onto the point cloud and to delineate regions that contain a high composition of Ag [in this case, more than 5 atomic % (at %) after decomposition of the peaks, with a delocalization of 1.5 nm × 1.5 nm × 1.5 nm on a grid of 1 nm × 1 nm × 1nm]. The Ag-rich pockets appear like nanoscale flakes of Ag that originate from the dealloying process. We extracted the subset of the data contained within the isocomposition marked by a red ellipse and have displayed the corresponding mass spectrum in gray. The peaks of Ag are clearly above the level of background, and the local composition is close to 100% Ag. The difference in the evaporation field between the flake and the surrounding frozen water leads to a typical issue of trajectory overlaps, which, for high-evaporation field particles, result in an underestimation of the local composition (56) and an overestimation of the size. Despite these complexities, results demonstrate that our approach enables analysis of nanostructures embedded in ice, and this could be further translated to embedding other nanostructures of interest.
Fig. 3. Mass spectra from a floating silver flake and the surrounding ice.
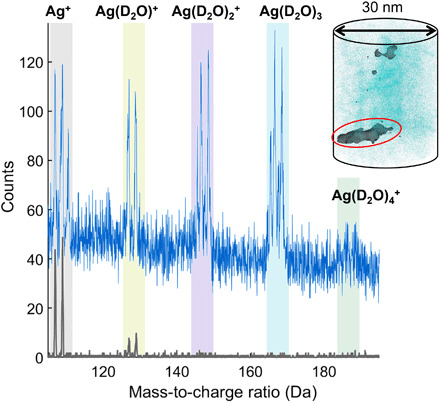
Mass spectrum for a 30-nm-diameter and 35-nm-long cylinder, shown in the inset, from within frozen NaCl-containing solution is shown in blue. Inset shows the group of Ag+ ions surrounded by ice with an isosurface value of 10 at % for Ag. Mass spectrum from within the flake, marked in red in the inset, is shown in gray.
We can also report on the ice-NPG interface and the ice embedded within the highly porous network of Au-rich nanoligaments. Important questions arise regarding the effects of size confinement on ice when considering the water inside the nanopores, as impact on phase growth (57), solute distribution (58), (59), and electrical conductivity is expected (60). Here, we can map the chemical composition across the water-substrate interface. Figure 4 demonstrates the capability of analyzing the ice/NPG continuously. The corresponding voltage curve is shown in fig. S9, and a shank angle–based tomographic reconstruction of that section of the data is displayed in Fig. 4A. The slice through the reconstruction in Fig. 4B reveals a series of Ag-rich (at the core) nanoligaments from the NPG and a high composition of Na and Cl at the metal-ice interface and in the nanoporous layer. We isolated one of the several imaged nanoligaments within the nanoporous layer, as shown in Fig. 4C. Figure 4D shows a compositional profile calculated across the interface between the ice layer and this nanoligament, while Fig. 4E shows a compositional profile calculated in between two nanoligaments.
Fig. 4. Near-atomic-scale mapping of chemical compositions across frozen gold-water interface.

(A) 3D reconstruction and analysis of the interface between the NPG substrate and the NaCl-containing ice. O is used to mark the position of all water clusters. (B) A 5-nm-thick slice through the tomogram in (A) along the plane marked by the dashed purple line, evidencing Ag-rich ligaments and the distribution of Cl and Na ions in between. (C) Compositional profile along a 5-nm-diameter cylinder crossing into the interface between a nanoligament and the ice, along the green arrow marked in (D), i.e., along the ligament’s main axis. The line in gray is the sum of Au and Ag compositions. (E) Composition profile in between two ligaments, along the yellow arrow in (D), showing the local increase in Na and Cl in between ligaments. The line in gray is the sum of Au and Ag composition. The shaded regions correspond to the 2σ of the counting statistic in each bin.
As we expect from previous APT studies (31) on NPG, nanoligaments show a Ag-rich core and Au-rich surfaces, attributed to the surface diffusion and agglomeration of Au atoms during the selective dissolution of Ag atoms. For the case of Au and Ag, hydrated and hydrogenated molecular ions are observed, likely coming from the ice-NPG interface (15). The composition in Ag at the ligament core is higher than might be expected (77 at %), as the surface diffusion–based model of the dealloying process supports a composition at the ligament core that is close to the bulk composition of the parent alloy. Trajectory aberrations arising from the high-evaporation field of the nanoligaments, compared to the hydrous matrix, will lead to trajectory overlaps that will affect the compositional estimates—this might explain the relatively low composition of water around the ligaments, as atoms originating from the ligaments are subject to strong aberrations and are imaged as part of the pores, typical of the aberrations caused by differences in the electric field necessary for field evaporation (61).
The cations and anions in the NaCl solution have a high affinity to the NPG surfaces. Experiments performed in the range of hundreds of nanometers to several micrometers above the NPG interface showed no signs of Na or Cl, as evidenced in fig. S10. The profiles in Fig. 4 (D and E) show compositions of Na and Cl that can reach up to 10 and 3 at %, respectively. This can be explained by the cooling rate being too slow to freeze the cations/anions in place during the quench. Thermodynamically, the nanopores are expected to be the last sites to freeze, so the growth of the ice from the surface of the water layer toward the porous layer pushes the Na and Cl ions into the pores. This was seen previously in studies focused on the solute concentration distribution in NaCl solutions and others but never on this scale (62). Na+ ion was detected around the nanoligaments as elemental ion Na+ and as the hydrated Na(D2O)+. Hydrated metal ions are not an anomaly, as they were observed with Si in previous field evaporation studies on adsorbed water layers (63). Chlorine also appears as complex ions such as ClO3+. Further experimentation will help optimize conditions to maximize compositional accuracy.
Influence of acquisition parameters on APT data
Here, we highlight the outcomes of our first foray into how the main experimental parameters influenced the collected APT data for the frozen aqueous samples. APT experiments are typically performed at a constant detection rate, which is maintained by the acquisition software’s control algorithm. The standing electrostatic field (controlled by the applied standing voltage) is the main factor affecting the detection rate, but the detection rate is affected by other user-defined parameters, for example, the pulsed field strength in high voltage (HV) pulsing (controlled by the pulse fraction, a percentage of the standing voltage) and the thermal pulse response (controlled by the laser pulse energy). As either of these user-defined parameters are decreased, the evaporation rate and, consequentially, detection rate decrease. In response, the control algorithm compensates by increasing the standing voltage so as to increase the standing electrostatic field. This compensates for the lower field or temperature reached at the specimen’s surface following the HV pulse or laser light absorption by the specimen. For laser pulsing, this leads to a notable change in the relative ratio of molecular ions detected. Figure 5 reports on the relative abundance of the different molecular ions across the studied pulsing energies. The data were obtained from a single specimen. A short experiment (170,000 ions) was also performed using HV pulsing with a pulse fraction of 15%. This corresponds to the conditions with the highest electrostatic field across the parameters tested here. A separate mass spectrum is provided in figs. S11 and S12.
Fig. 5. Relative molecular ion abundances as a function of the laser pulse energy and in high-voltage pulsing mode.

Relative amount of different cluster ions observed in the analysis of D2O ice at pulsing energies ranging from 20 to 100 pJ. Pulsing fraction for the HV measurement was 15%.
Tsong (63) first reported that lower pulsing energies lead to a higher electrostatic field, which, in turn, favors the detection of smaller clusters, while higher pulsing energies lead to a lower electrostatic field, and this resulted in an increase of larger molecular ions (m = 4 and 5). Previous work examining field evaporation ionization of water showed that lower fields favor larger clusters (64). This trend could be changed, however, by the base temperature of the specimen during analysis. A temperature sweep experiment reported by Stintz and Panitz (65) was shown to affect the order of cluster abundance. A similar trend appears in our analyses of ice, with the larger cluster ions found at higher laser pulse energies. Furthermore, the HV pulsing analysis showed a considerable shift in ion abundances toward the dimer cluster, confirming the trend.
Separate oxygen and hydrogen/deuterium peaks from the dissociation of water were detected at low laser pulsing energies and in HV pulsing. Dissociation of water was also observed in close proximity to Ag/Au ions, i.e., close to the ice-metal interface, where the strength of the electrostatic field was higher, as evidenced by the rise in applied voltage (fig. S9). These conditions are closer to those previously reported on the analysis of ice by high-field techniques. The detection of elemental peaks in the case of ice depends on the intensity of the electrostatic field, consistent with previous observations by Tsong and Liou (66), who showed through field desorption experiments that protonated water clusters only dominate at lower electrostatic fields (higher pulsing energies).
It is critical to quantify the level of background to assess the sensitivity of the APT analysis of solutions. The background levels detected in most experiments were relatively high in comparison to usual APT analyses but could be lowered by changing the experimental parameters. Considering that ice is a notoriously poor heat conductor, we lowered the repetition rate of the laser to potentially avoid a possible pileup of thermal pulses. We observed a drop in the background level in the analysis of D2O-NaCl ice and an enhanced signal-to-background ratio, as shown in Fig. 6. We investigated this more systematically, as we report on the estimated background level in a series of analyses of pure D2O as a function of the laser pulse energy and at a 200-kHz pulse repetition rate in Fig. 7A. Background level estimates are obtained according to the procedure implemented in the commercial software Cameca IVAS 3.8.4. The background level was not significantly reduced by lowering laser pulsing energy at 200 kHz. On the other hand, Fig. 7B shows that the background level correlates with the laser pulsing rate. These data series were obtained with a specimen made from the NaCl-containing solution far from the water-metal interface, where no discernible peaks of Na or Cl are detected, making these data comparable to the previous plot.
Fig. 6. Examples of mass spectra from frozen salt water at different pulse repetition rates.

Mass spectra from the NaCl-D2O water specimen at 200 and 25 kHz—note the difference in scale on the y axis.
Fig. 7. Effect of laser pulse energy and repetition rate on atom probe data.

Level of background (A) as a function of laser pulse energy at a pulsing rate of 200 kHz for D2O ice and (B) effect of the pulsing rate for D2O-NaCl ice at 60 pJ. (C and D) 2D detector hit maps for a range of parameters specified in each map.
Figure 7 (C and D) features the 2D detector histograms for different experimental parameters—varying pulse energy and pulse frequency, respectively—showing that the homogeneity of the field evaporation process increases with decreasing pulse energies. Figure S13 shows the histograms corresponding to the intensity distribution within each of the detector maps shown in Fig. 7 (C and D). A narrower histogram corresponds to a more homogenous distribution of intensities across the detector, which could be associated to a smoother specimen curvature. At a higher laser pulsing energy, the histograms appear slightly more homogeneous. Decomposing these spatial distributions into (D2O)xD+ water clusters is considered in figs. S14 and S15. Generally, the smaller clusters are more localized, unlike the larger clusters, which are more homogeneous across the detector. Similar to the case in Fig. 7C, it can be seen here that higher laser pulsing energies seem to produce more homogenous spatial distributions. Figure S15 suggests that the particular spatial distribution is not stable in time and, in a 3D reconstruction, the smaller water clusters do form “ribs,” but the physics behind their formation and how they relate to the original ice structure is not yet well understood. Other parameters such as the pulse frequency and detection rates seemed to have a limited effect on the map’s homogeneity.
Most of the background comes from the field evaporation of water by the electrostatic field rather than by a laser pulse—often referred to as dc evaporation. This takes place because the thermal agitation at the base temperature is sufficient to cause field evaporation. A drop in the level of background can be achieved either by lowering the specimen’s average temperature or by lowering the average electrostatic field. The absorption of light from the laser pulse leads to an increase in the tip’s temperature, subsequently cooled by heat conduction, akin to generating a thermal pulse. The cooling is typically a two-step process whereby the heat is first conducted away swiftly from the surface into the core of the specimen and then transported slowly (67) along the length of the specimen. For specimens with low heat conductivity, a pileup of pulses can arise if the conductivity is too low to allow the specimen to cool down back to the base temperature. In such a case, the laser pulsing rate controls how much energy is supplied to the ice tip per second and, hence, a possible increase in the average temperature.
At a lower detection rate, the data are acquired over a longer period in between two pulses; at a repetition rate of 200 kHz, ions can only be collected over ~5 μs, whereas at 25 kHz, ions can be collected over ~40 μs. Over this longer integration period, more hits from the ions generated from dc evaporation accumulate, which leads to a drop in the dc voltage that is adjusted to maintain the average detection rate. This, in turn, lowers the electrostatic field.
When comparing the distribution of molecular ions at 200 kHz to that obtained at 25 kHz, the fraction of the smaller fragments is relatively higher, suggesting that the electrostatic field is higher at 200 kHz, which could originate from both a lower average temperature or a lower integration of background. The shape of individual mass peaks suggests that the cooling process is fast, similar in magnitude to metals and most semiconductor—i.e., no slow decay seems to be observed. This implies that an increase in the average specimen’s temperature is unlikely but not impossible. The lower background at lower repetition rates can hence be ascribed mostly to the higher background integration time resulting in a lower dc field.
Aspects of the APT analysis of ice and performance limits
Our preliminary results show that using water as a carrier medium to enable the analysis of nanomaterials will require fine-tuning of the experimental conditions so as to maximize the signal-to-background ratio, particularly around mass-to-charge ratios where ions of interest are expected to be found. It is critical to minimize the background level to maximize the sensitivity of the APT analysis of aqueous solutions. There is no unique definition of the detection sensitivity in APT, and multiple approaches already exist to provide numerical estimates (6, 8). A metric for the compositional sensitivity should combine the mass resolution, i.e., how high a mass peak is for a given number of detected ions, the number of stable isotopes that lead to lower peak amplitude potentially, and also the local level of background that could obscure this specific set of peaks. We provide here an estimate for the case of Na ions in a deuterated solution. The background level at 23 Da, where the peak for the single stable isotope of Na is located, is approximately 500 counts in a dataset containing 1 million ions. Considering the criterion for the detection sensitivity defined in (6), with a confidence level of 95% (~2σ), a reasonable number of Na+ count to ensure the detection of the peak should be 50 to 100. This yields a sensitivity of approximately 0.005 to 0.01 at %, which can be translated into approximately 3 to 6 mM. This value of detection sensitivity would matter in the case where the plunge freezing had allowed vitrification, and Na was homogeneously distributed within the frozen solution. Here, the Na was highly concentrated near the NPG-liquid interface and within the nanopores, facilitating its detection. The present set of data will help guide future optimizations of the experimental parameters to maximize sensitivity for specific elements.
Field evaporation mechanism
The success of our experiments might be initially considered as counterintuitive; Stuve and colleagues (13) predicted that the applied field needed to initiate ionization increases as a function of increasing the ice layer thickness, due to dielectric screening by the water layer, thicker water layers being more effective at screening the field at the water-vacuum interface. Experiments and modeling in Stuve and colleagues’ work show the electrostatic field to be concentrated at the interface between the needle-shaped specimen and the water. The difference in our experiment is that our entire specimen was made of ice, leading to the conclusion that an electrostatic field must be concentrated at the ice-vacuum interface throughout the experiment. The expected electrostatic field intensity is also much lower in our case, compared to other recent reports where the field is sufficiently high to lead, typically, to the fragmentation of the water molecules (15, 55).
It was pointed out by Perea et al. (68) that the mode of specimen transfer and experimental conditions influence the nature of the molecular ions detected and that it was potentially possible to detect long singly ionized chains, suggesting their controlled field-induced desorption and ionization. This is an important consideration, because little is known and understood about the dissociation process of long, complex carbon chains found, for instance, in the field evaporation and APT analysis of polymers and biomolecules (20, 69, 70, 71), making their reconstruction and reconstitution extremely challenging, if not impossible. Conversely to other recent reports where the analysis of liquids was performed on thin layers of ice, formed on very sharp needle-shaped specimens, and hence subjected to very intense fields, our approach enables a gentler field evaporation, with the hope that complete molecules or only mildly fragmented molecules could be detected.
The current data might not allow us to pinpoint precisely which is the most prominent field evaporation mechanism active during laser-pulsed or high voltage–induced field evaporation. There are several possible mechanisms that can lead to the detection of singly charged monomers or polymers of water molecular ions. First, as in the case of metals, a partially charged molecule can be progressively repelled from the surface under the influence of the electrostatic field, as it undergoes simultaneous ionization and desorption (72). Very local rearrangements of the electric field have been observed experimentally on metal surfaces, as shown by molecular dynamics for instance (73). Second, surface migration processes are assisted by the electrostatic field itself and typically follow electrostatic field gradients. These phenomena are thermally activated (74), and the activation barriers for field evaporation and surface migration are both lowered by the electrostatic field (75). There is a possibility that localized migration processes lead to a rearrangement of the specimen’s surface; atomistic simulations (76) showed how several surface atoms can jointly diffuse, a process also observed experimentally (77). Here, following the departure of a water molecule or molecular cluster from the surface, the rearrangement of charges at the specimen’s apex can drive short-range migration of the molecules, which can then combine to form a polymer, as also predicted by atomistic calculations (54). These local processes could explain the detection of the larger molecular ions detected in our experiments.
Last, we postulate that these mobile, fully or partially charged molecules can flow much more freely on the surface than within the bulk ice, forming a liquid-like layer that acts as a medium between the bulk ice and the vacuum. The increase in temperature, subsequent to the laser pulses, provides thermal agitation that facilitates migration within this layer. A similar layer was reported in liquid metal ion sources, albeit at much higher temperatures (78). In either case, the electrostatic field is the key parameter driving the reorganization of the molecules at the surface. The demonstrated capacity of the specimen to “evacuate the charges” indicates that there is ionic conductivity and hence that the surface is composed of at least partially charged molecules, making them prone to delocalization under the influence of the electric field. Within this confined zone, individual molecules or polymers migrate toward the loci of most intense electrostatic field at the specimen’s surface, where they can field evaporate. This hypothesis, shown schematically in Fig. 8, explains the pattern formed on the detector (Fig. 7B) as well as the high level of background, at least in part.
Fig. 8. Schematic showing the main parts of the specimen and possible steps involved in the proposed mechanism for pulsed field evaporation of ice.

The background can be attributed to the loosely bonded molecules that leave the specimen at a time uncorrelated with the laser pulse. The surface gets stabilized by the field desorption and ionization or field evaporation of the least stable surface atoms or molecules (73). This implies that following the removal of a molecule, the rearrangement of the surface can lead to molecular migrations and potentially, at a later stage, the removal of one or more molecular ions. Figure S16 shows a correlation histogram, see (79) and references therein, for an analysis of NaCl-D2O. Numerous vertical and horizontal trails indicate the detection of ions coevaporated with various water clusters yet with a delay that hinders their identification. There is also continuous evaporation evidenced by the faint diagonal lines. These ions certainly contribute to the background. There also appears to be some indication of molecular ion dissociation that could very well lead to neutral molecules, which, in part, could go undetected (79). More information may, in the future, be gathered from such analyses to extract more information than only from the mass-to-charge spectra with the accompanying high background.
DISCUSSION
The approach introduced here has overcome the barriers faced by conventional FIB/APT analysis of liquid layers and nanostructures encapsulated in liquid layers. We demonstrated the use of NPG as a substrate for making ice needles in combination with a cryo-PFIB that is suitable for atom probe analysis. The results in this investigation demonstrate the capability of analyzing bulk ice layers and their use in probing encapsulated nanoligaments and surrounding solvated ions at the near-atomic scale. Our approach paves the way for using nanoporous metals to routinely investigate liquid layers and encapsulated nanostructures. An important optimization to make in this regard is the chemistry of the nanoporous metal and the pore size. Thermal coarsening of nanoporous metals to control feature size is possible through thermal coarsening studies (79). Replacing Au by other metals, with lower evaporation field, could eliminate some of the aberrations at the ice-solid interface and within the nanopores. Attempting other mesoporous and nanoporous systems with different feature sizes can lead to numerous studies in their own right—in particular not only on the influence of pore size on the local solubility but also on the composition of the layer near the surface of, for example, catalysts. Within the ice layer itself, there will be opportunities for analyzing the distribution of solutes and the early stage of formation of precipitates, including the possible role of incorporation of impurities. Our set of experiments is a first, yet major, step forward toward enabling near-atomic–scale, analytical imaging of chemical, biochemical, and biological systems.
MATERIALS AND METHODS
Dealloying
A 1-cm2 sample of AgAu foil was polished and annealed for 1 hour at 900°C in an inert Ar atmosphere. Then, the sample was immersed in 10 ml of solution of 65% nitric acid for 5 min. The dealloying was then quenched by transferring the sample to a solution of D2O [Sigma-Aldrich (Germany), 99.9 at % for D]. The sample was then quickly mounted on a Cu APT clip, making sure it is never dry and left immersed in D2O overnight (see fig. S1). For another set of samples, the procedure above was repeated for NPG immersed in 50 mM NaCl-D2O solutions [Sigma-Aldrich (Germany), American Chemical Society reagent, 99.0%].
D2O treatment and freezing
Freezing of the sample was carried out inside a nitrogen glove box, supplied with a constant flow of dry liquid N2, to limit the formation of frost on the sample. Dew point inside the glove box was kept as low as −99°C, and the oxygen levels were kept below 1 ppm. Freezing of the sample was done by swiftly removing the immersed clip from the D2O solution, followed by slight blotting of the surface using a kimwipe, to avoid large volumes of ice accumulating on top of the surface, and then directly immersing the whole clip into dry liquid N2 for 5 min. Then, the sample is quickly loaded onto a cryogenic UHV suitcase and transferred to Xe-PFIB for APT specimen fabrication.
Cryo-FIB equipment
All details on this specific setup forming the Laplace Project at the Max-Planck-Institute für Eisenforschung GmbH are reported in (9). It revolves around a dual-beam SEM/FIB FEI Helios PFIB with a Xe-plasma source. A custom solid-state cooling stage connected to a dewar and a cold finger are fitted. The cryo-stage is isolated from the SEM by a series of vacuum polyether ether ketone spacers and accommodates a commercial puck that carries APT specimens.
The protocol introduced by Halpin et al. (38) was adapted to dig a moat and leave a pillar in the middle. The pillar is then sharpened using a Xe-plasma beam. Milling currents range from 1.3 to 0.1 μA at 30 kV. The ice specimen length was ensured to be no more than 5 μm (see the Supplementary Materials).
Cooling rates
We cannot currently state any specific experimental values as to how fast the cooling is—this is subject to future theoretical and experimental work. We could, however, propose a higher and lower estimate for our cooling rates through simple calculations that assume the heat transfer to be a 1D problem and that the freezing begins at the water–liquid nitrogen interface traveling toward the pores. The higher cooling rate assumes that none of the liquid nitrogen is vaporized or that any vaporized liquid nitrogen would travel instantly away from the surface by the action of buoyancy forces, while the lower cooling rate assumes that once the water touches the liquid nitrogen, a super-cooled layer of gaseous nitrogen is formed. Using the mathematical model developed for Newtonian cooling by natural convection and with the assumption that our heat transfer model resembles that of a vertical flat surface cooled by a fluid (81), (82), we arrive at two possible cooling rates.
First, the heat transfer coefficient is calculated
| (1) |
where
| (2) |
| (3) |
| (4) |
We will assume that the cooling of the water film is Newtonian, as the following mathematical condition is satisfied
| (5) |
Thus, the temperature of the water at different times could be analyzed through the following relation
| (6) |
Although it is justified to assume Newtonian cooling, the solution above does eliminate the contribution of convective currents within the thin water layer. In addition, the conduction from the metallic holder is neglected. Therefore, future simulations will be dedicated to taking all such factors into consideration for a better understanding of the cooling process throughout the water component of the system. Variable definitions, values used for this calculation, and approximated cooling rates are listed in table S1. Schematic for freezing experiment is also included in fig. S2.
Specimen handling/transfer
After final milling, the cryo-prepared specimens were transferred from the PFIB chamber to a side chamber, which is maintained in a UHV and at approximately −160°C, for less than 15 s, and then into the precooled UHV carry suitcase, maintained at approximately −190°C. The suitcase is then detached from the PFIB and mounted onto a Cameca LEAP (local electrode atom probe) 5000 XS system. The cold puck is then transferred under cryo-UHV conditions to the atom probe analysis chamber.
Atom probe tomography
APT analysis was conducted using a Cameca LEAP 5000 XS atom probe (Cameca Instruments, USA). Data were acquired while operating in laser-pulsing mode with a pulse of 20 to 100 pJ and a pulse rate of 25 to 200 kHz. The target evaporation rate was set to 0.003 or 0.005 ions per pulse (0.3 or 0.5%) by adjusting an applied dc voltage (typically ranging from approximately 2 to 5 kV). An example of ice APT specimen alignment to atom probe local (counter) electrode and the measurement are shown in fig. S7. The base temperature for the specimen stage was set to 70 K throughout the measurement, and the chamber pressure was in the 10−11 torr range. Reconstruction and analysis were performed using IVAS 3.8.4, using SEM images of the tips to assist with spatial calibration of the reconstructions, as well as custom routines in MATLAB software.
Supplementary Material
Acknowledgments
We thank J. M. Cairney from the University of Sydney for discussions that led to us thinking of using NPG as a support. We thank U. Tezins, C. Broß, A. Sturm, and A. Breen for support to the FIB and APT facilities at MPIE. R.C.N acknowledges support by an NSERC Discovery Grant (RGPIN-2014-03995) and Accelerator Supplement (RGPAS 462039-14). Funding: We are grateful for the financial support from the BMBF via the project UGSLIT and the Max-Planck Gesellschaft via the Laplace Project. A.A.E.-Z., S.-H.K., L.T.S., and B.G. acknowledge financial support from the ERC-CoG-SHINE-771602. Author contributions: B.G., A.A.E.-Z., S.-H.K., and L.T.S. initiated the study and designed the experiments. A.A.E.-Z., S.-H.K., and L.T.S. prepared the samples and carried out the experiments. A.A.E.-Z., S.-H.K., L.T.S., and B.G. analyzed, interpreted, and plotted the data. S.D. provided scientific background and contributed to discussion on the redistribution and confinement of solutes during freezing. R.C.N. provided the NPG and contributed to discussions on the dealloying process. B.G. and A.A.E.-Z. drafted the manuscript, and all authors contributed to the writing process, commenting, and editing. Competing interests: The authors declare that they have no competing interests. Data and materials availability: All data needed to evaluate the conclusions in the paper are present in the paper and/or the Supplementary Materials. Additional data related to this paper may be requested from the authors.
SUPPLEMENTARY MATERIALS
Supplementary material for this article is available at http://advances.sciencemag.org/cgi/content/full/6/49/eabd6324/DC1
REFERENCES AND NOTES
- 1.Nobel Prize® and the Nobel Prize® medal design mark are registered trademarks of the Nobel Foundation Scientific Background on the Nobel Prize in Chemistry 2017 THE DEVELOPMENT OF CRYO-ELECTRON MICROSCOPY (2017).
- 2.Park J., Elmlund H., Ercius P., Yuk J. M., Limmer D. T., Chen Q., Kim K., Han S. H., Weitz D. A., Zettl A., Alivisatos A. P., 3D structure of individual nanocrystals in solution by electron microscopy. Science 349, 290–295 (2015). [DOI] [PubMed] [Google Scholar]
- 3.Chen C.-C., Zhu C., White E. R., Chiu C.-Y., Scott M. C., Regan B. C., Marks L. D., Huang Y., Miao J., Three-dimensional imaging of dislocations in a nanoparticle at atomic resolution. Nature 496, 74–77 (2013). [DOI] [PubMed] [Google Scholar]
- 4.Yang Y., Chen C.-C., Scott M. C., Ophus C., Xu R., Pryor A., Wu L., Sun F., Theis W., Zhou J., Eisenbach M., Kent P. R. C., Sabirianov R. F., Zeng H., Ercius P., Miao J., Deciphering chemical order/disorder and material properties at the single-atom level. Nature 542, 75–79 (2017). [DOI] [PubMed] [Google Scholar]
- 5.Zhou J., Yang Y., Yang Y., Kim D. S., Yuan A., Tian X., Ophus C., Sun F., Schmid A. K., Nathanson M., Heinz H., An Q., Zeng H., Ercius P., Miao J., Observing crystal nucleation in four dimensions using atomic electron tomography. Nature 570, 500–503 (2019). [DOI] [PubMed] [Google Scholar]
- 6.W. Lefebvre-Ulrikson, F. Vurpillot, X. Sauvage, Atom Probe Tomography: Put Theory into Practice (Academic Press, 2016). [Google Scholar]
- 7.De Geuser F., Gault B., Metrology of small particles and solute clusters by atom probe tomography. Acta Mater. 188, 406–415 (2020). [Google Scholar]
- 8.Haley D., London A. J., Moody M. P., Processing APT spectral backgrounds for improved quantification. Microsc. Microanal. 26, 964–977 (2020). [DOI] [PubMed] [Google Scholar]
- 9.Stephenson L. T., Szczepaniak A., Mouton I., Rusitzka K. A. K., Breen A. J., Tezins U., Sturm A., Vogel D., Chang Y., Kontis P., Rosenthal A., Shepard J. D., Maier U., Kelly T. F., Raabe D., Gault B., The Laplace Project: An integrated suite for preparing and transferring atom probe samples under cryogenic and UHV conditions. PLOS ONE 13, e0209211 (2018). [DOI] [PMC free article] [PubMed] [Google Scholar]
- 10.Schreiber D. K., Perea D. E., Ryan J. V., Evans J. E., Vienna J. D., A method for site-specific and cryogenic specimen fabrication of liquid/solid interfaces for atom probe tomography. Ultramicroscopy 194, 89–99 (2018). [DOI] [PubMed] [Google Scholar]
- 11.McCarroll I. E., Bagot P. A. J., Devaraj A., Perea D. E., Cairney J. M., New frontiers in atom probe tomography: A review of research enabled by cryo and/or vacuum transfer systems. Mater. Today Adv. 7, 100090 (2020). [DOI] [PMC free article] [PubMed] [Google Scholar]
- 12.Stintz A., Panitz J. A., Imaging atom-probe analysis of an aqueous interface. J. Vac. Sci. Technol. 9, 1365–1367 (1991). [Google Scholar]
- 13.Pinkerton T. D., Scovell D. L., Johnson A. L., Xia B., Medvedev V., Stuve E. M., Electric field effects in ionization of water-ice layers on platinum. Langmuir 15, 851–855 (1999). [Google Scholar]
- 14.G. Schwarz, T. Stender, P. Schmitz, in 1st Virtual NRW-APT User Meeting (2020). [Google Scholar]
- 15.Qiu S., Zheng C., Garg V., Chen Y., Gervinskas G., Li J., Dunstone M. A., Marceau R. K. W., Fu J., Three-dimensional chemical mapping of a single protein in the hydrated state with atom probe tomography. Anal. Chem. 92, 5168–5177 (2020). [DOI] [PubMed] [Google Scholar]
- 16.J. A. Panitz, in Microscopy and Microanalysis (Cambridge University Press, 2005), vol. 11, pp. 92–93. [Google Scholar]
- 17.Panitz J. A., Point-projection imaging of unstained ferritin clusters. Ultramicroscopy 7, 241–248 (1982). [Google Scholar]
- 18.Narayan K., Prosa T. J., Fu J., Kelly T. F., Subramaniam S., Chemical mapping of mammalian cells by atom probe tomography. J. Struct. Biol. 178, 98–107 (2012). [DOI] [PMC free article] [PubMed] [Google Scholar]
- 19.Prosa T. J., Kostrna Keeney S., Kelly T. F., Atom probe analysis of poly(3-alkylthiophene)s. J. Microsc. 237, 155–167 (2010). [DOI] [PubMed] [Google Scholar]
- 20.Perea D. E., Liu J., Bartrand J., Dicken Q., Thevuthasan S. T., Browning N. D., Evans J. E., Atom probe tomographic mapping directly reveals the atomic distribution of phosphorus in resin embedded ferritin. Sci. Rep. 6, 22321 (2016). [DOI] [PMC free article] [PubMed] [Google Scholar]
- 21.Cho C. H., Singh S., Wilse Robinson G., Liquid water and biological systems: The most important problem in science that hardly anyone wants to see solved. Faraday Discuss. 103, 19–27 (1996). [DOI] [PubMed] [Google Scholar]
- 22.Nickerson B. S., Karahka M., Kreuzer H. J., Disintegration and field evaporation of thiolate polymers in high electric fields. Ultramicroscopy 159, 173–177 (2015). [DOI] [PubMed] [Google Scholar]
- 23.Eder K., Felfer P. J. J., Gault B., Ceguerra A. V. V., La Fontaine A., Masters A. F. F., Maschmeyer T., Cairney J. M. M., A new approach to understand the adsorption of thiophene on different surfaces: An atom probe investigation of self-assembled monolayers. Langmuir 33, 9573–9581 (2017). [DOI] [PubMed] [Google Scholar]
- 24.Tedsree K., Li T., Jones S., Chan C. W. A., Yu K. M. K., Bagot P. A. J., Marquis E. A., Smith G. D. W., Tsang S. C. E., Hydrogen production from formic acid decomposition at room temperature using a Ag-Pd core-shell nanocatalyst. Nat. Nanotechnol. 6, 302–307 (2011). [DOI] [PubMed] [Google Scholar]
- 25.Kim S.-H., Jang K., Kang P. W., Ahn J.-P., Seol J.-B., Kwak C.-M., Hatzoglou C., Vurpillot F., Choi P.-P., Characterization of Pd and Pd@Au core-shell nanoparticles using atom probe tomography and field evaporation simulation. J. Alloys Compd. 831, 154721 (2020). [Google Scholar]
- 26.Perea D. E., Allen J. E., May S. J., Wessels B. W., Seidman D. N., Lauhon L. J., Three-dimensional nanoscale composition mapping of semiconductor nanowires. Nano Lett. 6, 181–185 (2006). [DOI] [PubMed] [Google Scholar]
- 27.Lim J., Kim S. H., Aymerich Armengol R., Kasian O., Choi P. P., Stephenson L. T., Gault B., Scheu C., Atomic-scale mapping of impurities in partially reduced hollow TiO2 nanowires. Angew. Chem. Int. Ed. 59, 5651–5655 (2020). [DOI] [PMC free article] [PubMed] [Google Scholar]
- 28.Kim S.-H., Lim J., Sahu R., Kasian O., Stephenson L. T., Scheu C., Gault B., Direct imaging of dopant and impurity distributions in 2D MoS2. Adv. Mater. 32, 1907235 (2020). [DOI] [PubMed] [Google Scholar]
- 29.Felfer P., Li T., Eder K., Galinski H., Magyar A. P., Bell D. C., Smith G. D. W., Kruse N., Ringer S. P., Cairney J. M., New approaches to nanoparticle sample fabrication for atom probe tomography. Ultramicroscopy 159, 413–419 (2015). [DOI] [PubMed] [Google Scholar]
- 30.Kim S.-H., Kang P. W., Park O. O., Seol J.-B., Ahn J.-P., Lee J. Y., Choi P.-P., A new method for mapping the three-dimensional atomic distribution within nanoparticles by atom probe tomography (APT). Ultramicroscopy 190, 30–38 (2018). [DOI] [PubMed] [Google Scholar]
- 31.El-Zoka A. A., Langelier B., Botton G. A., Newman R. C., Enhanced analysis of nanoporous gold by atom probe tomography. Mater Charact 128, 269–277 (2017). [Google Scholar]
- 32.R. P. Wayne, Chemistry of Atmospheres: An Introduction to the Chemistry of the Atmospheres of Earth, the Planets, and Their Satellites (Oxford Univ. Press, 2000). [Google Scholar]
- 33.Sprenger M., Stumpp C., Weiler M., Aeschbach W., Allen S. T., Benettin P., Dubbert M., Hartmann A., Hrachowitz M., Kirchner J. W., McDonnell J. J., Orlowski N., Penna D., Pfahl S., Rinderer M., Rodriguez N., Schmidt M., Werner C., The demographics of water: A review of water ages in the critical zone. Rev. Geophys. 57, 800–834 (2019). [Google Scholar]
- 34.Duley W. W., Molecular clusters in interstellar clouds. Astrophys. J. 471, L57–L60 (1996). [Google Scholar]
- 35.Khusnatdinov N. N., Petrenko V. F., Levey C. G., Electrical properties of the ice/solid interface. J. Phys. Chem. B 101, 6212–6214 (1997). [Google Scholar]
- 36.R. C. Newman, Shreir’s Corrosion (Elsevier Science, 2010), pp. 801–809. [Google Scholar]
- 37.Raspal V., Awitor K. O., Massard C., Feschet-Chassot E., Bokalawela R. S. P., Johnson M. B., Nanoporous surface wetting behavior: The line tension influence. Langmuir 28, 11064–11071 (2012). [DOI] [PubMed] [Google Scholar]
- 38.Halpin J. E., Webster R. W. H., Gardner H., Moody M. P., Bagot P. A. J., MacLaren D. A., An in-situ approach for preparing atom probe tomography specimens by xenon plasma-focussed ion beam. Ultramicroscopy 202, 121–127 (2019). [DOI] [PubMed] [Google Scholar]
- 39.Miller M. K., Russell K. F., Thompson G. B., Strategies for fabricating atom probe specimens with a dual beam FIB. Ultramicroscopy 102, 287–298 (2005). [DOI] [PubMed] [Google Scholar]
- 40.Thompson K., Lawrence D., Larson D. J., Olson J. D., Kelly T. F., Gorman B., In situ site-specific specimen preparation for atom probe tomography. Ultramicroscopy 107, 131–139 (2007). [DOI] [PubMed] [Google Scholar]
- 41.Gemma R., Al-Kassab T., Kirchheim R., Pundt A., Analysis of deuterium in V–Fe5at.% film by atom probe tomography (APT). J. Alloys Compd. 509, S872–S876 (2011). [Google Scholar]
- 42.Breen A. J., Stephenson L. T., Sun B., Li Y., Kasian O., Solute hydrogen and deuterium observed at the near atomic scale in high-strength steel. Acta Mater. 188, 108–120 (2020). [Google Scholar]
- 43.Chen Y.-S., Lu H., Liang J., Rosenthal A., Liu H., Sneddon G., McCarroll I., Zhao Z., Li W., Guo A., Cairney J. M., Observation of hydrogen trapping at dislocations, grain boundaries, and precipitates. Science 367, 171–175 (2020). [DOI] [PubMed] [Google Scholar]
- 44.Cairney J., Atoms on the move—Finding the hydrogen. Science 355, 1128–1129 (2017). [DOI] [PubMed] [Google Scholar]
- 45.Chang Y. H., Mouton I., Stephenson L., Ashton M., Zhang G. K., Szczpaniak A., Lu W. J., Ponge D., Raabe D., Gault B., Quantification of solute deuterium in titanium deuteride by atom probe tomography with both laser pulsing and high-voltage pulsing: Influence of the surface electric field. New J. Phys. 21, 053025 (2019). [Google Scholar]
- 46.Moore E. B., Molinero V., Structural transformation in supercooled water controls the crystallization rate of ice. Nature 479, 506–508 (2011). [DOI] [PubMed] [Google Scholar]
- 47.Bassim N. D., De Gregorio B. T., Kilcoyne A. L. D., Scott K., Chou T., Wirick S., Cody G., Stroud R. M., Minimizing damage during FIB sample preparation of soft materials. J. Microsc. 245, 288–301 (2012). [Google Scholar]
- 48.Marko M., Hsieh C., Schalek R., Frank J., Mannella C., Focused-ion-beam thinning of frozen-hydrated biological specimens for cryo-electron microscopy. Nat. Methods 4, 215–217 (2007). [DOI] [PubMed] [Google Scholar]
- 49.Panitz J. A., Stintz A., Imaging atom-probe analysis of a vitreous ice interface. Surf. Sci. 246, 163–168 (1991). [Google Scholar]
- 50.Carrasco J., Hodgson A., Michaelides A., A molecular perspective of water at metal interfaces. Nat. Mater. 11, 667–674 (2012). [DOI] [PubMed] [Google Scholar]
- 51.Silaeva E. P., Arnoldi L., Karahka M. L., Deconihout B., Menand A., Kreuzer H. J., Vella A., Do dielectric nanostructures turn metallic in high-electric dc fields? Nano Lett. 14, 6066–6072 (2014). [DOI] [PubMed] [Google Scholar]
- 52.Kelly T. F., Vella A., Bunton J. H., Houard J., Silaeva E. P., Bogdanowicz J., Vandervorst W., Laser pulsing of field evaporation in atom probe tomography. Curr. Opin. Solid State Mater. Sci. 18, 81–89 (2014). [Google Scholar]
- 53.Block D. L., Cocke J. H., Field ion and field desorption mass spectrometry of inorganic compounds. Surf. Sci. 70, 363–391 (1978). [Google Scholar]
- 54.Karahka M., Kreuzer H. J., Water whiskers in high electric fields. Phys. Chem. Chem. Phys. 13, 11027–11033 (2011). [DOI] [PubMed] [Google Scholar]
- 55.Qiu S., Garg V., Zhang S., Chen Y., Li J., Taylor A., Marceau R. K. W., Fu J., Graphene encapsulation enabled high-throughput atom probe tomography of liquid specimens. Ultramicroscopy 216, 113036 (2020). [DOI] [PubMed] [Google Scholar]
- 56.Vurpillot F., Bostel A., Blavette D., Trajectory overlaps and local magnification in three-dimensional atom probe. Appl. Phys. Lett. 76, 3127–3129 (2000). [Google Scholar]
- 57.J. Bluhm, T. Ricken, M. Bloßfeld, Ice formation in porous media, in Advances in Extended and Multifield Theories for Continua, B. Markert, Ed. (Springer, 2011), pp. 153–174. [Google Scholar]
- 58.Bazant M. Z., Theory of electrochemical kinetics based on nonequilibrium thermodynamics. Acc. Chem. Res. 46, 1144–1160 (2013). [DOI] [PubMed] [Google Scholar]
- 59.Ginot F., Lenavetier T., Dedovets D., Deville S., Solute strongly impacts freezing under confinement. Phys. Appl. Lett. 116, 253701 (2020). [Google Scholar]
- 60.Fumagalli L., Esfandiar A., Fabregas R., Hu S., Ares P., Janardanan A., Yang Q., Radha B., Taniguchi T., Watanabe K., Gomila G., Novoselov K. S., Geim A. K., Anomalously low dielectric constant of confined water. Science 360, 1339–1342 (2018). [DOI] [PubMed] [Google Scholar]
- 61.Wang X., Hatzoglou C., Sneed B., Fan Z., Guo W., Jin K., Chen D., Bei H., Wang Y., Weber W. J., Vurpillot F., Poplawsky J. D., Interpreting nanovoids in atom probe tomography data for accurate local compositional measurements. Nat. Commun. 11, 1022 (2020). [DOI] [PMC free article] [PubMed] [Google Scholar]
- 62.Körber C., Scheiwe M. W., Wollhöver K., Solute polarization during planar freezing of aqueous salt solutions. Int. J. Heat Mass Transf. 26, 1241–1253 (1983). [Google Scholar]
- 63.Tsong T. T., Formation of silicon and water cluster ions in pulsed-laser stimulated field desorption. J. Vac. Sci. Technol. B 3, 1425–1430 (1985). [Google Scholar]
- 64.Stuve E. M., Ionization of water in interfacial electric fields: An electrochemical view. Chem. Phys. Lett. 519–520, 1–17 (2012). [Google Scholar]
- 65.Stintz A., Panitz J. A., Cluster ion formation in isothermal ramped field–desorption of amorphous water ice from metal surfaces. Surf. Sci. 296, 75–86 (1993). [Google Scholar]
- 66.Tsong T. T., Liou Y., Cluster-ion formation in pulsed-laser-stimulated field desorption of condensed materials. Phys. Rev. B Condens. Matter 32, 4340–4357 (1985). [DOI] [PubMed] [Google Scholar]
- 67.Vurpillot F., Houard J., Vella A., Deconihout B., Thermal response of a field emitter subjected to ultra-fast laser illumination. J. Phys. D Appl. Phys. 42, 125502 (2009). [Google Scholar]
- 68.Perea D. E., Gerstl S. S. A., Chin J., Hirschi B., Evans J. E., An environmental transfer hub for multimodal atom probe tomography. Adv. Struct. Chem. Imag. 3, 12 (2017). [DOI] [PMC free article] [PubMed] [Google Scholar]
- 69.Wang L. R. C., Kreuzer H. J., Nishikawa O., Polythiophene in strong electrostatic fields. Org. Electron. 7, 99–106 (2006). [Google Scholar]
- 70.Nishikawa O., Kato H., Atom-probe study of a conducting polymer: The oxidation of polypyrrole. J. Chem. Phys. 85, 6758–6764 (1986). [Google Scholar]
- 71.Rusitzka K. A. K., Stephenson L. T., Szczepaniak A., Gremer L., Raabe D., Willbold D., Gault B., A near atomic-scale view at the composition of amyloid-beta fibrils by atom probe tomography. Sci. Rep. 8, 17615 (2018). [DOI] [PMC free article] [PubMed] [Google Scholar]
- 72.Forbes R. G., Field evaporation theory: A review of basic ideas. Appl. Surf. Sci. 87–88, 1–11 (1995). [Google Scholar]
- 73.Katnagallu S., Dagan M., Parviainen S., Nematollahi A., Grabowski B., Bagot P. A. J., Rolland N., Neugebauer J., Raabe D., Vurpillot F., Moody M. P., Gault B., Impact of local electrostatic field rearrangement on field ionization. J. Phys. D Appl. Phys. 51, 105601 (2018). [Google Scholar]
- 74.Wang Q., Kinkus T. J., Ren D. G., A study of the process of field evaporation as Markov chains. Surf. Sci. 197, 327–338 (1988). [Google Scholar]
- 75.Tsong T. T., Kellogg G., Direct observation of directional walk of single adatoms and adatom polarizability. Phys. Rev. B 12, 1343–1353 (1975). [Google Scholar]
- 76.Oberdorfer C., Withrow T., Yu L.-J., Fisher K., Marquis E. A., Windl W., Influence of surface relaxation on solute atoms positioning within atom probe tomography reconstructions. Mater Charact 146, 324–335 (2018). [Google Scholar]
- 77.Tsong T. T., Quantitative investigations of atomic processes on metal surfaces at atomic resolution. Prog. Surf. Sci. 10, 165–248 (1980). [Google Scholar]
- 78.Driesel W., Dietzsch C., Niedrig H., Praprotnik B., HV TEM in situ investigations of the tip shape of a gallium liquid-metal ion/electron emitter. Ultramicroscopy 57, 45–58 (1995). [Google Scholar]
- 79.Gault B., Saxey D. W., Ashton M. W., Sinnott S. B., Chiaramonti A. N., Moody M. P., Schreiber D. K., Behavior of molecules and molecular ions near a field emitter. New J. Phys. 18, 33031 (2016). [Google Scholar]
- 80.El-Zoka A., Howe J. Y., Newman R. C., Perovic D. D., In situ STEM/SEM Study of the Coarsening of Nanoporous Gold. Acta Mater. 162, 67–77 (2019). [Google Scholar]
- 81.D. R. Poirier, G. H. Geiger, Transport Phenomena in Materials Processing (Springer, 2016). [Google Scholar]
- 82.W. H. McAdams, Heat Transmission (McGraw-Hill, ed. 3, 1954). [Google Scholar]
- 83.Loi S. T., Gault B., Ringer S. P., Larson D. J., Geiser B. P., Electrostatic simulations of a local electrode atom probe: The dependence of tomographic reconstruction parameters on specimen and microscope geometry. Ultramicroscopy 132, 107–113 (2013). [DOI] [PubMed] [Google Scholar]
- 84.M. W. Chase Jr., NIST-JANAF Thermochemical Tables (American Institute of Physics, ed. 4, 1998). [Google Scholar]
- 85.J. E. Jensen, W. A. Tuttle, R. B. Stewart, H. Brechna, A. G. Prodell, Brookhaven National Laboratory Selected Cryogenic Data Notebook (Brookhaven National Laboratory, Associated Universities, Inc., 1980). [Google Scholar]
Associated Data
This section collects any data citations, data availability statements, or supplementary materials included in this article.
Supplementary Materials
Supplementary material for this article is available at http://advances.sciencemag.org/cgi/content/full/6/49/eabd6324/DC1