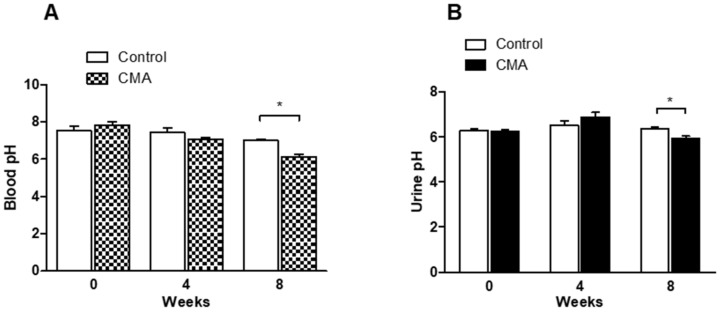
Figure 2.
Blood (A) and urine (B) pH measurements. Each bar represents values expressed as mean ± SEM. The change in pH was considered significant (*) when p < 0.05 between two groups. The data were analyzed using two-way ANOVA followed by Bonferroni posttests. Measurement of blood pH (A) and urine pH (B) in control and chronic metabolic acidosis (CMA) animals.

