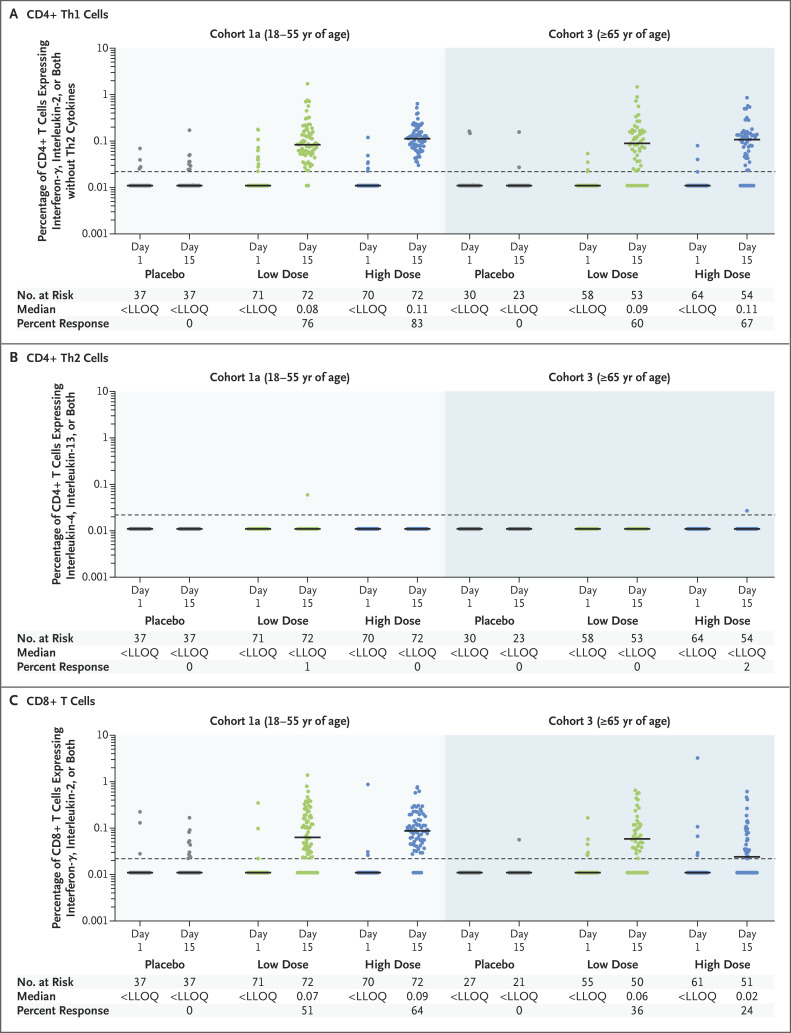
Figure 3. Cellular Immunogenicity of Ad26.COV2.S.
In CD4+ T cells, the response to low-dose or high-dose vaccine or placebo in type 1 helper T (Th1) cells was characterized by the expression of interferon-γ, interleukin-2, or both, without cytokines expressed by type 2 helper T (Th2) cells (Panel A). The response in CD4+ Th2 cells was characterized by the expression of interleukin-4, interleukin-5, or interleukin-13 (or all three cytokines) plus CD40L (Panel B). In CD8+ T cells, the response was measured by the expression of interferon-γ, interleukin-2, or both (Panel C). In all three panels, the horizontal bars indicate median values on intracellular cytokine staining for individual responses to a SARS-CoV-2 S protein peptide pool in peripheral-blood mononuclear cells at baseline and 15 days after vaccination in a subgroup of participants in cohort 1a (left side) and cohort 3 (right side), according to the receipt of the low or high dose of Ad26.COV2.S or placebo. The horizontal dotted line in each panel indicates the lower limit of quantitation (LLOQ); values below the line have been imputed to half the LLOQ.

