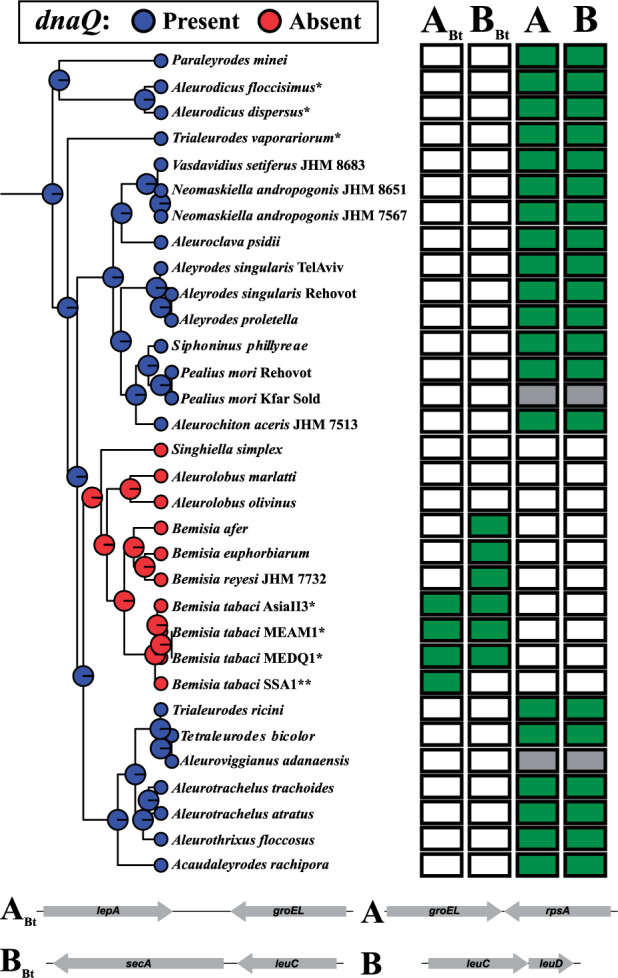
Fig. 3.

Summary of the screening for the dnaQ gene presence or absence and the gene rearrangements. Ancestral state inference was estimated using the Portiera 5G-based tree (left). Pie charts at the nodes represent the posterior probability for the presence (blue) or absence (red) of dnaQ. Note that all nodes have the probability of 1. The matrix represents the gene rearrangement amplification results (right). The letters above the matrix indicate the four possible rearrangements that were tested. Letters without index refer to the ancestral gene order found in Portiera of Aleurodicus and Trialeurodes vaporariorum. Letters with the subindex Bt refer to the gene order found in Portiera of Bemisia tabaci (bottom). White squares denotes unsuccessful amplifications, green filled squares represent successful amplifications, and gray filled squares indicate that the gene order rearrangements were not tested but the ancestral one (A and B) is assumed. *Full genome available and **no transcripts containing the BBt region were obtained.
