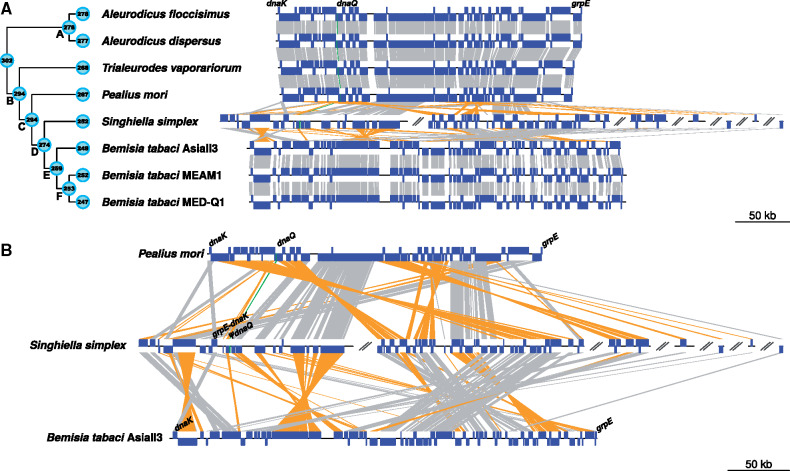
Fig. 4.
Portiera genomes syntenic comparisons based on 230 single-copy core genes. (A) Cladogram summarizing Portiera phylogenetic relationships based on the species tree obtained as part of the OrthoFinder pipeline. Filled circles at the nodes represent the number of coding genes estimated to be present in the MRCA using COUNT. Filled circles at the leaf tips represent the number of coding genes in each Portiera genome. Letters at the nodes list the MRCAs to allow comparison with figure 5. Portiera genomes are represented linearly. Blue boxes representing syntenic genes in the direct strand (upwards) or in the complementary strand (downwards), gray lines connect genes in the same strand, yellow lines connect genes in different strands, and twisted lines indicate inversions. The green line highlights the position of functional and nonfunctional (ψ) dnaQ genes. For Portiera of Singhiella simplex, only contigs containing core genes are represented (seven from nine contigs). (B) Magnification of synteny comparisons between Portiera of Pealius mori, S. simplex, and Bemisia tabaci AsiaII3.

