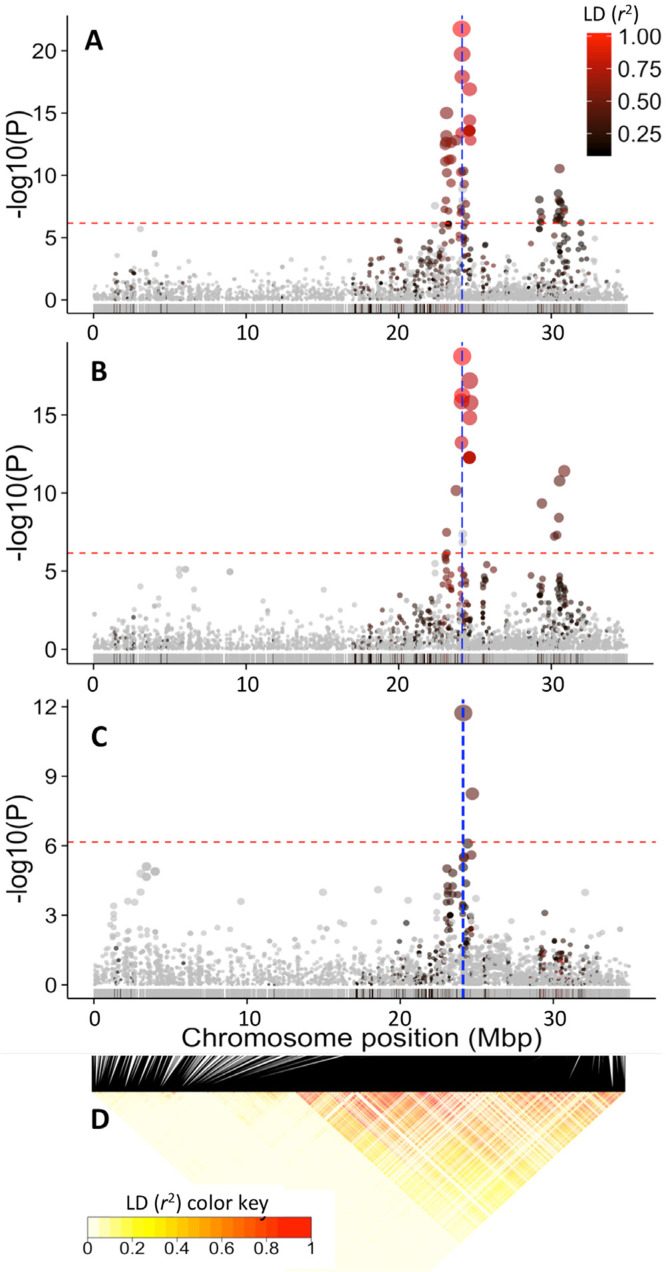
Fig. 7.
Genome-wide association studies (GWAS) results for chromosome 1. Manhattan plot of the mixed-linear model for: (A) root yellowness as measured by chromameter b* value, (B) color chart, (C) dry matter content, and (D) linkage disequilibrium (LD) heatmap showing pairwise squared correlation of alleles between markers along chromosome 1. Note the common peak at ~ 24.1 Mbp region for the three traits. Red horizontal line indicates the genome-wide significance threshold. The SNPs are colored according to their degree of linkage disequilibrium (r2) with the leading variant (i.e., top SNP for the first peak at 24.1 Mbp). The vertical blue line in (A) and (B) denote the position of the carotenoid biosynthesis gene, phytoene synthase (24,155,070 bp), and the two adjacent blue lines in (C) denotes the positions of the UDP-glucose pyrophosphorylase (24,061,652 bp) and sucrose synthase (24,142,314 bp).

