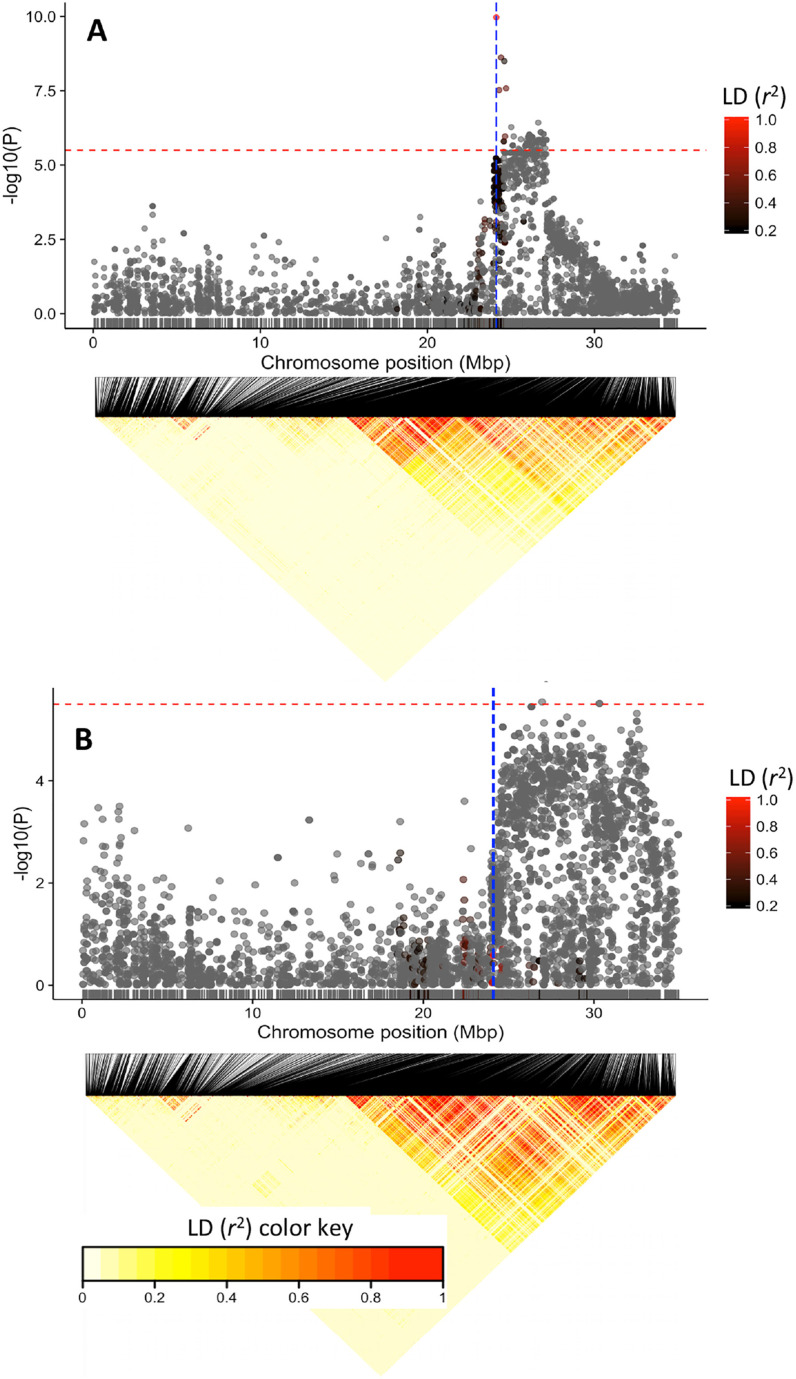
Fig. 8.
Manhattan plots of the mixed-linear model (MLM) analysis of the yellow root (top) and white root subpopulations (bottom). Below each is an linkage disequilibrium (LD) heatmap showing pairwise squared correlation of alleles between markers along chromosome 1 for each subpopulation. Note the large number of single nucleotide polymorphisms (SNPs) showing significant association with dry matter in the white subpopulation compared to that of the yellow subpopulation. Red horizontal line indicates the genome-wide significance threshold. The vertical blue line in (A) denotes the position of the carotenoid biosynthesis gene, phytoene synthase (24,155,070 bp), and the two adjacent blue lines in (B) denote the positions of the UDP-glucose pyrophosphorylase (24,061,652 bp) and sucrose synthase (24,142,314 bp).

