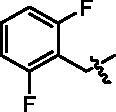
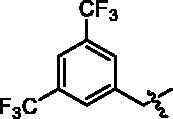
Table 1.
Enzyme inhibitory and antiproliferative activities of the derived hydroxamic acid containing compounds. 
| Compounds | R1 | HDACsa | U937b | U266b | HepG2b |
|---|---|---|---|---|---|
| I1 | –H | 53.81 ± 1.60 | 1.02 ± 0.13 | 0.84 ± 0.09 | 8.98 ± 0.16 |
| I2 |

|
78.94 ± 3.41 | 0.95 ± 0.04 | 0.48 ± 0.09 | 3.63 ± 0.26 |
| I3 | –C2H5 | 78.94 ± 2.34 | 0.94 ± 0.04 | 0.24 ± 0.03 | 1.92 ± 0.05 |
| I4 |

|
68.50 ± 1.22 | 0.97 ± 0.04 | 0.96 ± 0.08 | 4.45 ± 0.25 |
| I5 |

|
19.30 ± 1.60 | 4.42 ± 0.18 | 0.88 ± 0.07 | 6.17 ± 0.21 |
| I6 |

|
16.14 ± 1.07 | 1.25 ± 0.21 | 0.82 ± 0.06 | 7.72 ± 0.34 |
| I7 |

|
46.17 ± 2.94 | 0.95 ± 0.01 | 0.84 ± 0.06 | 4.87 ± 0.12 |
| I8 |

|
15.87 ± 3.27 | 1.94 ± 0.17 | 0.71 ± 0.06 | 6.45 ± 0.28 |
| I9 |

|
56.68 ± 2.42 | 1.00 ± 0.15 | 0.65 ± 0.04 | 5.67 ± 0.06 |
| I10 |

|
79.10 ± 4.65 | 0.63 ± 0.07 | 0.16 ± 0.07 | 3.39 ± 0.25 |
| I11 |

|
52.24 ± 1.10 | 4.58 ± 0.23 | 0.74 ± 0.05 | 4.76 ± 0.61 |
| I12 | –(CH2)3CH3 | 62.70 ± 1.63 | 1.01 ± 0.03 | 0.12 ± 0.02 | 5.76 ± 0.65 |
| I13 | –CH3 | 82.19 ± 1.60 | 0.93 ± 0.08 | 0.16 ± 0.04 | 1.85 ± 0.31 |
| SAHA | 59.91 ± 3.73 | 1.40 ± 0.02 | 0.88 ± 0.08 | 8.68 ± 0.29 |
Percentage inhibition rate (%, at the concentration of 1 µM), HeLa nucleus extract was used for the test. Each value is the mean of at least three experiments.
IC50, µM. Each value is the mean of at least three experiments.
