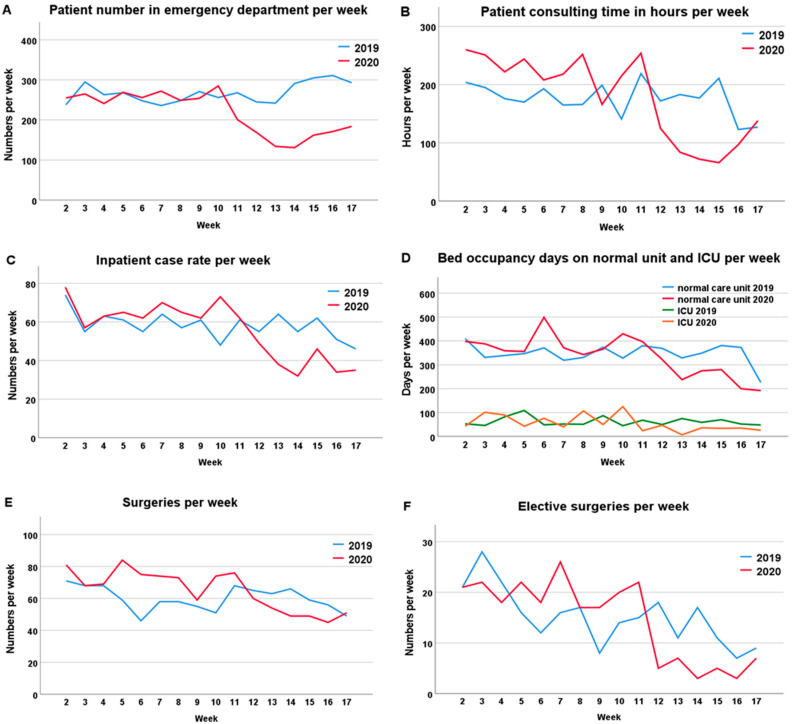
Figure 1.
Time course of patient presentations, surgeries, and inpatient case numbers. The data of the 2nd to 17th weeks in 2019 (blue) and in 2020 (red) were compared. From the 11th week onwards, a decrease in case numbers could be detected, which could be attributed to the COVID-19 pandemic. (A) Patient numbers in the emergency department per week; (B) Patients consulting hours per week; (C) Stationary case rates per week; (D) Bed occupancy days on the normal and intensive care units per week; (E) Number of surgeries per week; (F) Number of elective surgeries per week.

