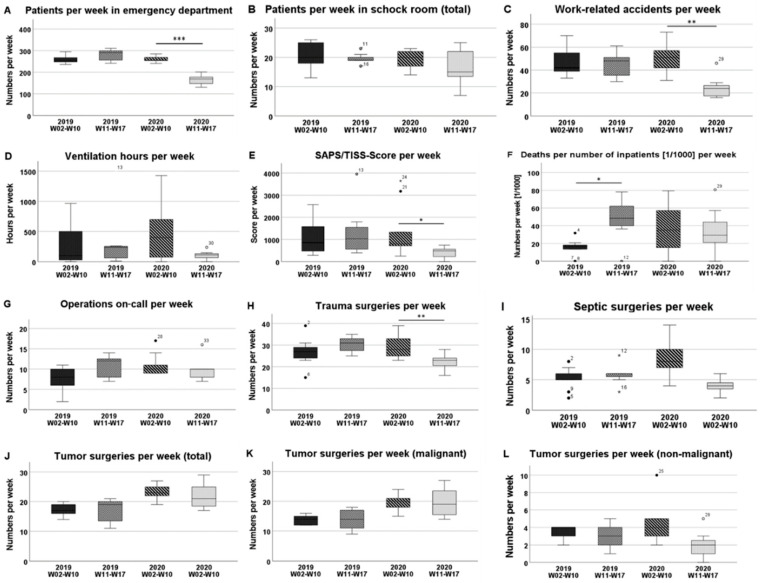
Figure 2.
Comparison of the time phases in 2019 and 2020. The boxplots represent the investigated parameters in weeks 02–10 and in weeks 11–17 in 2019 and in 2020. The significance levels are defined as * p < 0.05, ** p < 0.01, and *** p < 0.001. (A) Patient numbers per week in the emergency department; (B) Patient numbers per week in the shock room; (C) Work-related accidents per week; (D) Ventilation hours per week; (E) SAPS/TISS-Score per week; (F) Deaths per number of inpatients (1/1000) per week; (G) Operations on-call per week; (H) Trauma surgeries per week; (I) Septic surgeries per week; (J) Musculoskeletal tumor surgeries in total per week; (K) Malignant or uncertain musculoskeletal tumor surgeries per week; (L) Non-malignant musculoskeletal tumor surgeries per week.

