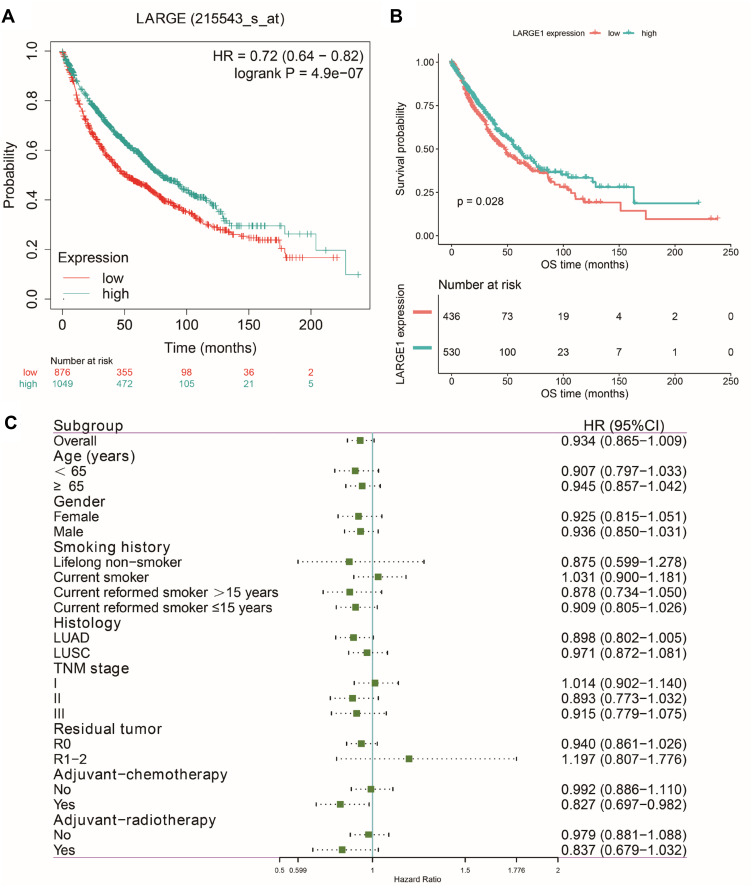
Figure 2.
Effects of LARGE1 on overall survival (OS) in NSCLC. (A) OS difference between NSCLC patients with high and low LARGE1 expression analyzed by the web-tool, Kaplan-Meier plotter, using auto select best cutoff value and the JetSet best probe set (215543_s_at). (B) OS difference between TNM I–III NSCLC patients with high and low LARGE1 expression from TCGA, analyzed by Kaplan-Meier curve with Log rank test. (C) Forest plot of the hazard ratios (HRs) for the associations of increasing LARGE1 expression (serves as a continuous variable) with overall survival (OS) of patients with TNM I–III NSCLC in subgroups stratified by age, gender, smoking history, histology, TNM stage, margin, adjuvant chemotherapy, and adjuvant radiotherapy.

