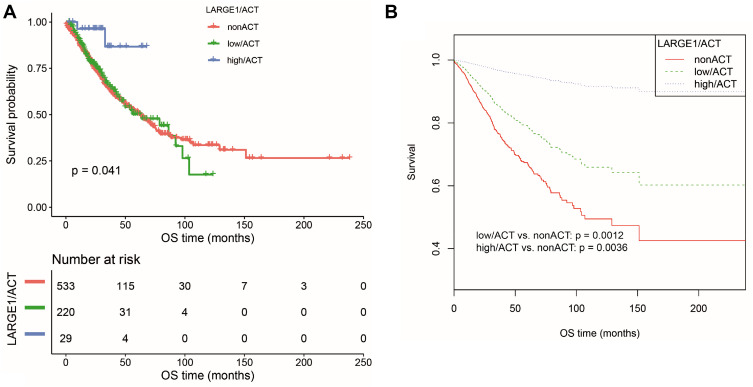
Figure 4.
OS difference in TNM I–III NSCLC patients stratified by combining LARGE1 expression and adjuvant chemotherapy (ACT), ie, non-ACT, low LARGE1/ACT, and high LARGE1/ACT. (A and B) LARGE1 expression was split into high and low groups by optimal cutoff value; OS difference of patients with non-ACT, low LARGE1/ACT, and high LARGE1/ACT was analyzed by Kaplan-Meier curve (A), which was also analyzed by adjusting the confounding factors (B).

