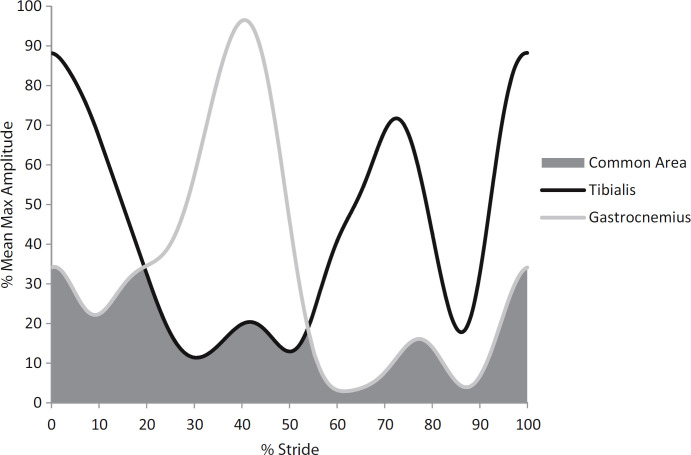
Fig 2. Calculation of lower limb muscle co-contraction index.
The EMG signals of the anterior tibialis and lateral gastrocnemius muscles were extracted from each stride of each walking trial, then averaged, and then normalized relative to the mean of the maximum EMG amplitudes for all strides. The common area is the overlapping region under the curves of the EMG signals and represents the muscle co-contraction index. Adapted from Lo et. al. 2017 [29].

