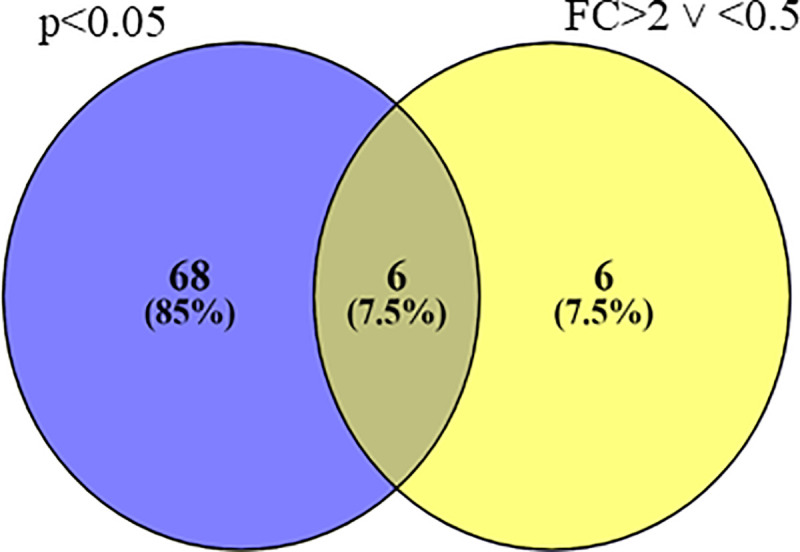
Fig 1. Protein groups.

The Venn diagram illustrates the number of proteins with a fold-change greater than 2 or less than 0.5 (yellow colour), those with a p-value below 0.05 (blue colour), and those that meet simultaneously both criteria based on protein levels between inoculated and control samples.
