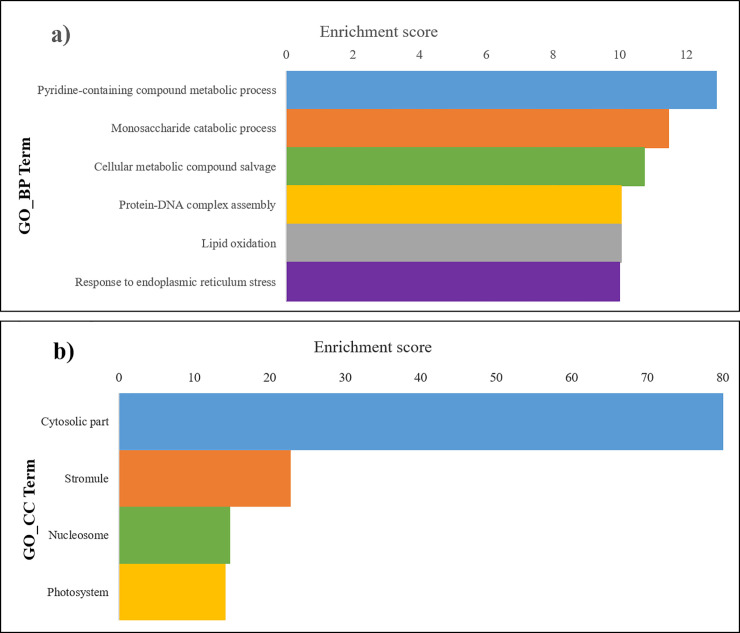
Fig 3. Enrichment analysis applied to the subset of 80 differential proteins.
The bars represents the groups with higher enrichment score [−log2 (group FDR)] obtained for each group of functional related GO terms; the enrichment of the Gene Ontology category of GO_BP are showed in panel a), and those for GO_CC in panel b). Each group is labelled by the most significant (<FDR) enriched term, used as representative of the total enriched terms in each group that can be consulted in detail in S4 and S5 Tables.

