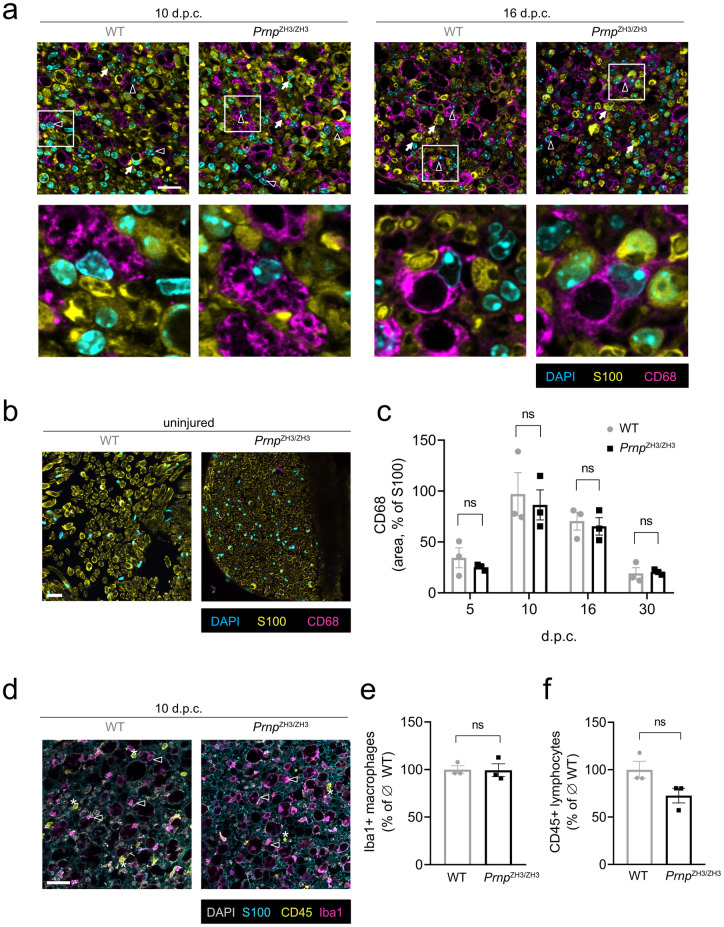
Fig 3. Recruitment of inflammatory cells.
(a) IF images of sciatic nerve cross sections from WT and PrnpZH3/ZH3 mice at 10 and 16 d.p.c. showed pronounced infiltration by CD68-positive macrophages. White triangles: CD68-positive macrophages. White arrows: S100-positive Schwann cells. Squares indicate region selected for blown-up images of macrophages shown in the lower panels. Scale bar 25 μM. (b) IF images of uninjured (contralateral) sciatic nerve showed no infiltration by macrophages. Scale bar 25 μM. (c) The extent of macrophage infiltration (quantified as the ratio of the CD68-positive area to the S100-positive area in IF images) was not significantly different when comparing WT and PrnpZH3/ZH3 mice at all investigated time points (two-way ANOVA, Sidak’s multiple comparisons test, p > 0.05). (d) IF images of sciatic nerve cross section from WT and PrnpZH3/ZH3 mice at 10 d.p.c showed infiltration by Iba1-positive macrophages (white triangles) and CD45-positive lymphocytes (white asterix). Scale bar 25 μM. (e) The number of macrophages as quantified from IF images was not significantly different when comparing WT and PrnpZH3/ZH3 mice (WT 100 ± 3.90 (3); PrnpZH3/ZH3 99.32 ± 6.80 (3); percentage of average macrophage number in WT; mean ± SEM (n); p = 0.9352; unpaired t-test). (f) The number of lymphocytes as quantified from IF images was not significantly different when comparing WT and PrnpZH3/ZH3 mice at 10 d.p.c. (WT 100 ± 8.88 (3); PrnpZH3/ZH3 72.63 ± 7.69 (3); percentage of average lymphocyte number in WT; mean ± SEM (n); p = 0.0803; unpaired t-test). n.s. = not significant.

