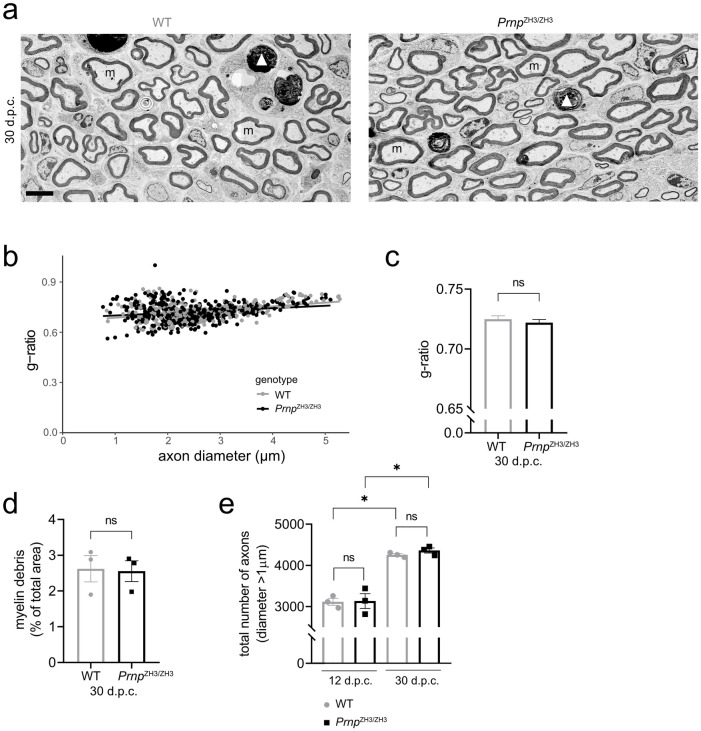
Fig 5. Remyelination at 30 d.p.c.
(a) EM images of sciatic nerves from WT and PrnpZH3/ZH3 mice at 30 d.p.c. showed remyelinated axons and little myelin debris remaining. m: myelinated axons, *: non-myelinated axon with > 1 μm diameter, white arrowhead: myelin debris. Scale bar 5 μm. (b, c) G-ratio analysis in WT (n = 3) and PrnpZH3/ZH3 (n = 3) mice at 30 d.p.c. Quantification of > 100 myelinated axons per mouse. Straight lines in (b) show linear regression. No significant difference in mean g-ratio (c) was detected between genotypes (unpaired t-test, p > 0.05). (d) Quantification of area covered by myelin debris at 30 d.p.c. showed no significant difference between WT (n = 3) and PrnpZH3/ZH3 (n = 3) mice (unpaired t-test, p > 0.05). (e) The total number of myelination competent axons with diameter > 1μm increased from 12 d.p.c. to 30 d.p.c. No significant difference was detected between WT and PrnpZH3/ZH3 mice at 12 or 30 d.p.c. (p > 0.05; one-way ANOVA, Sidak’s multiple comparisons test) *: p < 0.05. n.s. = not significant.

