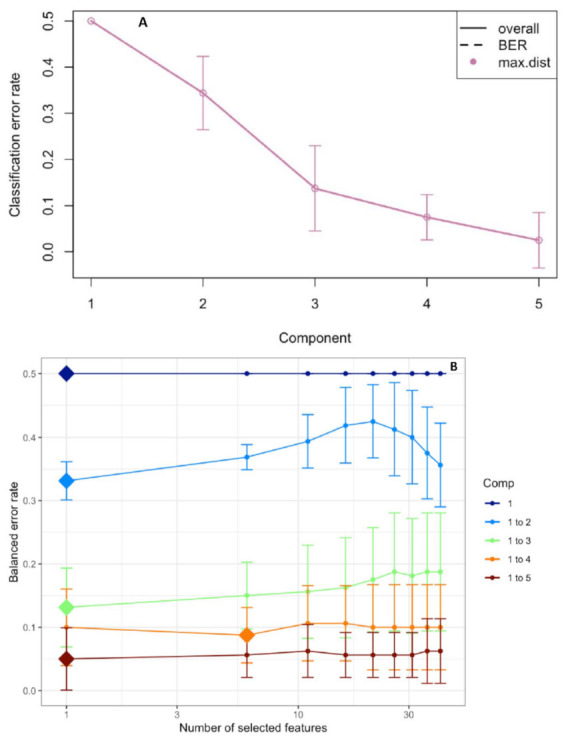
Figure 4.

Choosing the number of components in the sparse Partial Least Squares-Discriminant Analysis (sPLS-DA) by the performance test (A). Mean classification by the overall and balanced error rate (BER) (5 cross-validations averaged 50 times) for each sPLS-DA component. Choosing the number of root traits for each sPLS-DA component by a tuning test (B). Estimated classification balanced error rates for the root morphology dataset (5 cross-validations averaged 50 times) with respect to the number of selected root traits for the sparse exploratory approaches.
