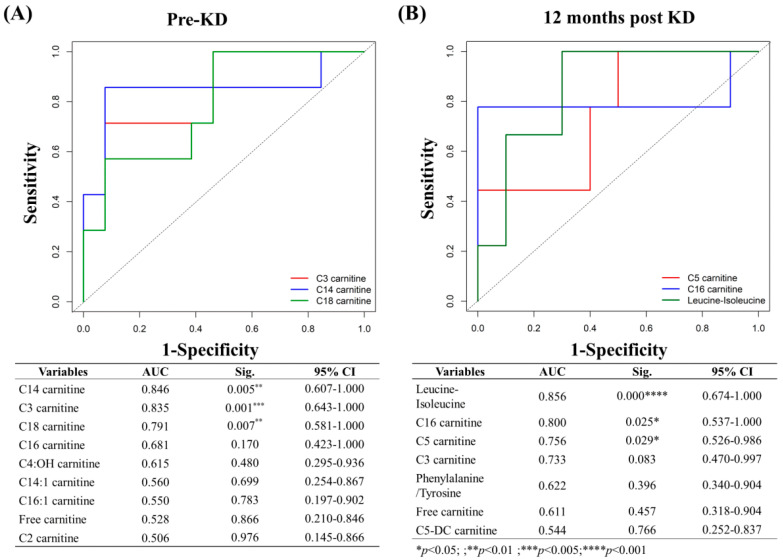
Figure 2.
Receiver-operating characteristic (ROC) analysis of the discriminant metabolites between groups. (A) Pre-KD; (B) 12 months post KD. Individual metabolites of significance (solid lines) are shown along with the reference (dotted line). Area under the curve (AUC) values, significance level, and 95% confidence interval are shown. (* p < 0.05; ** p < 0.01; *** p < 0.005; **** p < 0.001).

