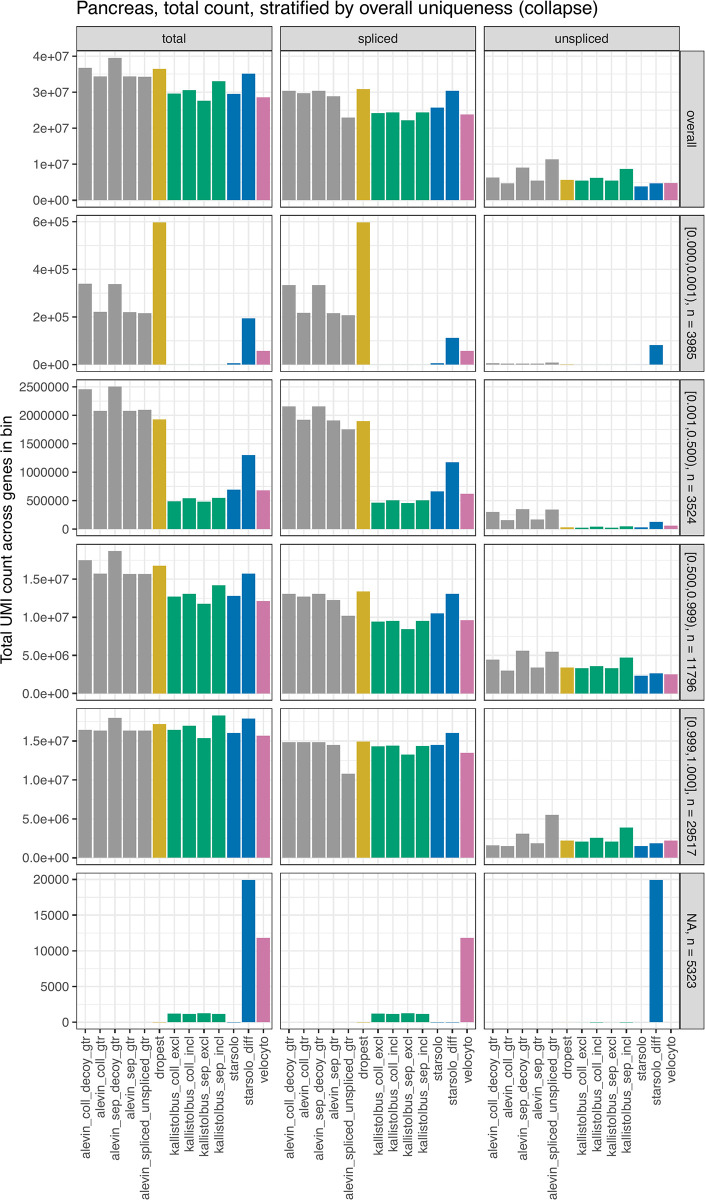
Fig 1. Total UMI count across genes and cells.
The bars correspond to the total UMI count, and the split of these into counts for exonic and intronic targets, for each quantification method in the Pancreas data set. Largely similar patterns were seen in the other four data sets. In addition to the overall count (top row), the figure shows the total count after stratifying genes by the overall fraction of unique k-mers (using the ‘collapse’ annotation), indicated in the vertical panel headers together with the number of genes in the category. The genes for which no uniqueness information could be calculated (the ‘NA’ category) are those for which all transcripts are shorter than the chosen k-mer length (which was set to the read length minus one; here 150nt).

