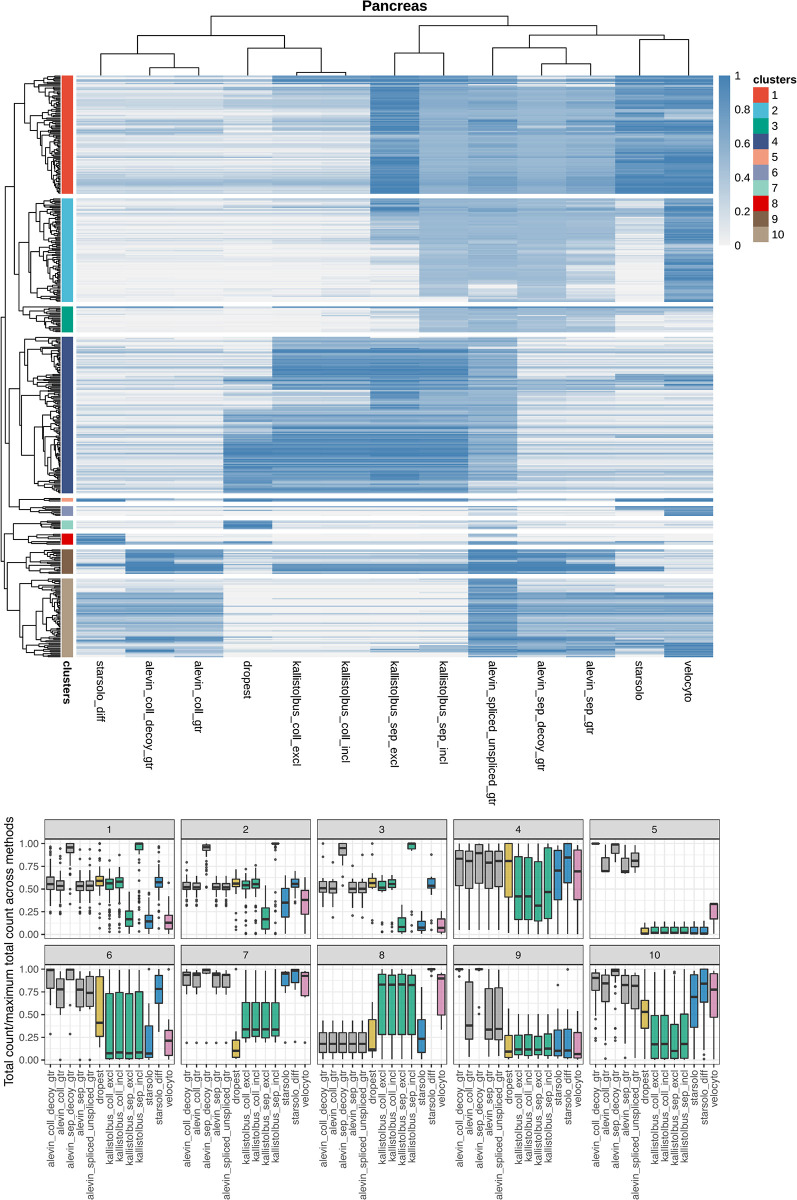
Fig 2. Clustering of genes based on the fraction of unspliced counts.
Top panel: Heatmap showing the unspliced UMI count fraction, across all cells, in the Pancreas data. The dendrogram was cut into 10 clusters, indicated by colors to the left of the heatmap. Bottom panel: Relative total count assigned to each gene by the different methods, stratified by gene cluster.

