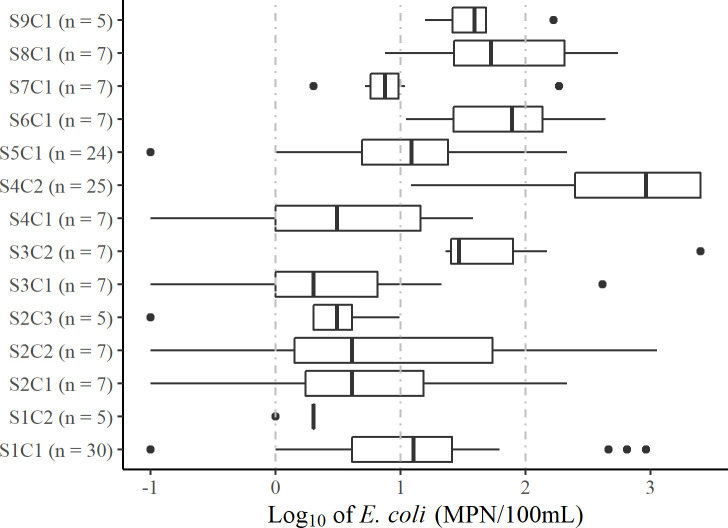
Fig 1. Box-and-whisker plot of log10-transformed monitoring programme E. coli results for selected PoCs.
The boxes show median values and span lower to upper quartiles, the whiskers show the lowest and highest datums within 1.5 times the interquartile range. Data are censored by a lower bound of 0 MPN/100 mL and an upper bound of > 2419.6 MPN/100mL. Results at the lower bound were converted to 0.1 (log = -1) and results at the upper bound were converted to 2500 (log = 3.4). Vertical dashed grey lines show the WHO recommended risk category cut-offs [26] with E. coli equal to 1, 10, and 100 MPN/100mL (corresponding to log values of 0, 1, and 2). The risk categories are low (<1), intermediate (1–9), high (10–99), and very high (>99).

