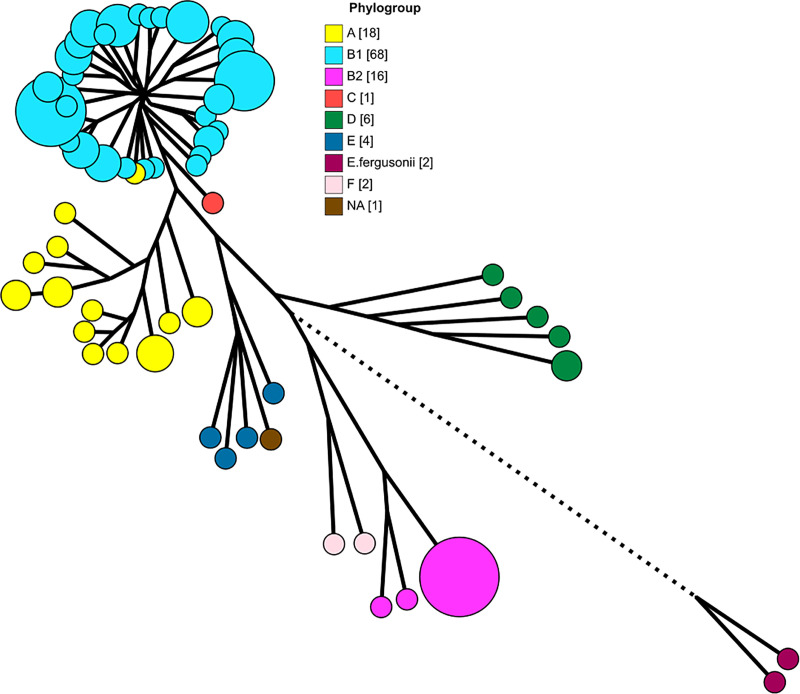
Fig 2. Phylogenetic tree with nodes coloured by phylogroup as determined by ClermonTyping.
The bracketed numbers in the image keys indicate the number of isolates in each category. The tree is scaled to 125% to make visual parsing easier. Branches with length less than 0.0006 nucleotide substitutions per site were collapsed and the size of the nodes is scaled to indicate the number of isolates each one encompasses. The branch length for E. fergusonnii was shortened from 0.05 to 0.03 substitutions per site.

