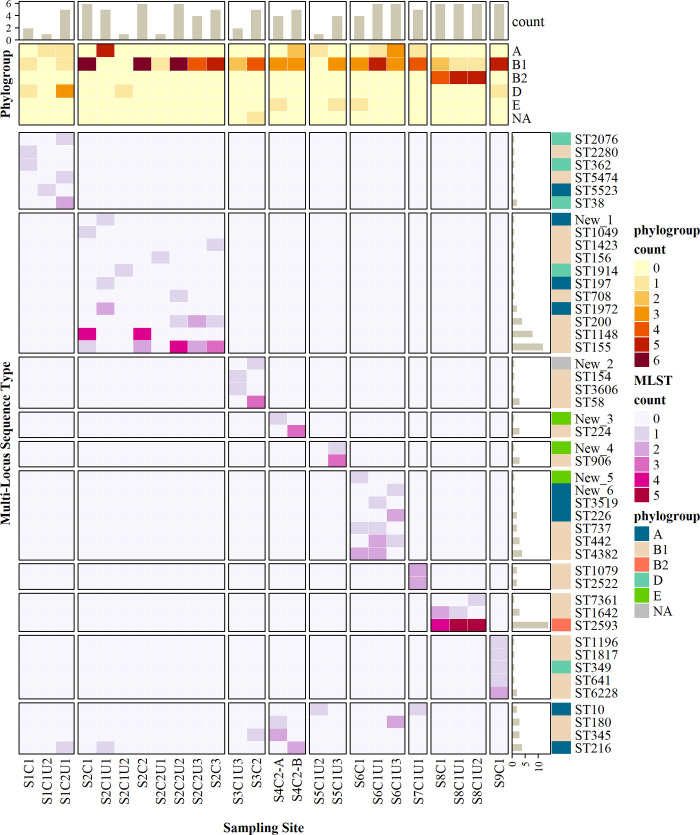
Fig 4. Heatmap of phylogenetic groups and MLSTs identified for each sampling site.
Colour gradients indicate number of isolates. Bar chart annotations show total counts of isolates per MLST (right) and per site (top). The heatmap was created with R package ‘ComplexHeatmap’ [74].

