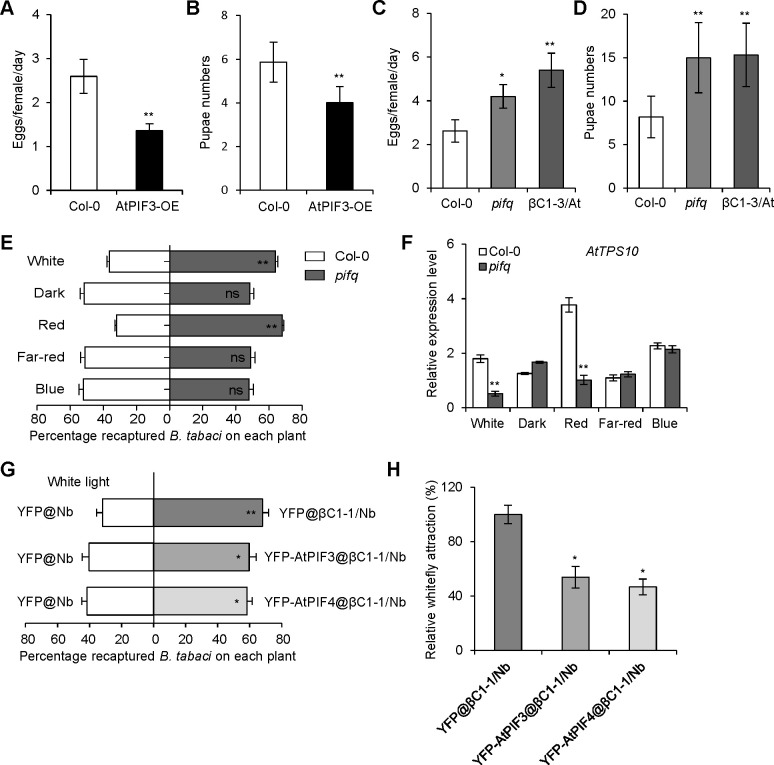
Fig 3. Arabidopsis PIFs confer tolerance to whitefly vector.
(A) Number of eggs laid per female whitefly per day on Col-0 and AtPIF3-overexpressing (AtPIF3-OE) transgenic plants. (B) Pupae numbers of whiteflies on Col-0 and AtPIF3-OE transgenic plants. (C) Number of eggs laid per female whitefly per day on Col-0, pifq or βC1-3/At plants. (D) Pupae numbers of whiteflies on Col-0, pifq or βC1-3/At plants. In A-D, values are mean ± SD (n = 8). Asterisks indicate significant differences of whitefly performance between Col-0 and mutant plants (*, P< 0.05; **, P< 0.01; Student’s t-test). (E) Whitefly preference on Col-0 and pifq mutant plants in response to white, dark, red, far-red, and blue light. The plants were placed in darkness for 24 h prior to the 2 h different light treatments. Values are mean + SD (n = 6) (**, P< 0.01; ns, no significant differences; the Wilcoxon matched pairs test). (F) Relative expression levels of AtTPS10 in Col-0 and pifq mutant plants after a 2 h treatment of different lights. Values are mean ± SD (n = 3) (**, P< 0.01; Student’s t-test). (G) Whitefly preference on transiently expressing AtPIFs in βC1-1/Nb and Nb plants with YFP overexpression under white light. Values are mean + SD (n = 6) (*, P< 0.05; **, P< 0.01; the Wilcoxon matched pairs test). (H) Relative whitefly attraction in transiently expressing AtPIFs in βC1-1/Nb plants. Relative whitefly attraction in YFP@βC1-1/Nb plants and YFP-AtPIFs@βC1-1/Nb was compared with those in YFP@/Nb plants. Whitefly attraction of YFP@βC1-1/Nb compared to YFP@/Nb plants was set as 100%. Values are mean ± SD (n = 6) (*, P< 0.05; Student’s t-test).

