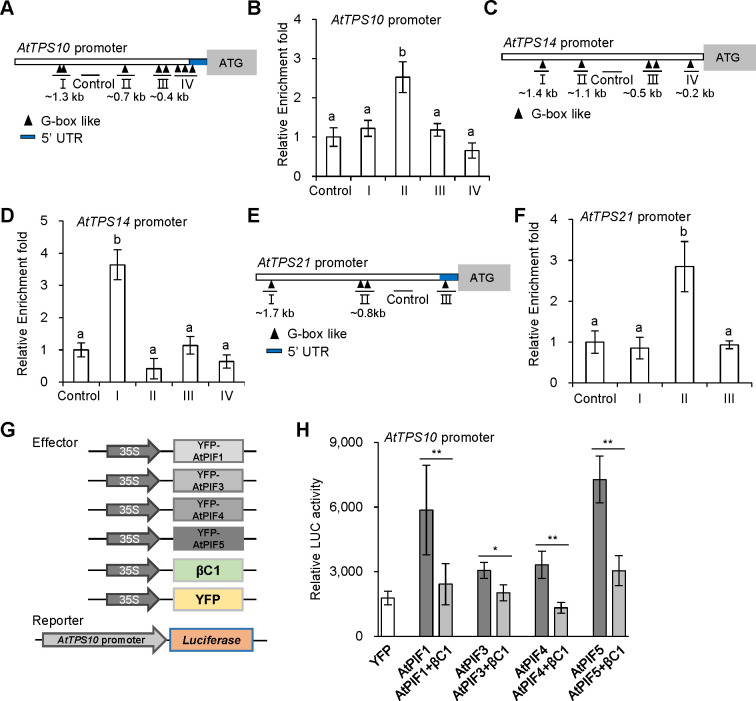
Fig 4. Arabidopsis PIFs directly regulate TPS genes and βC1 suppresses transcriptional activity of PIFs.
(A, C and E) Schematic diagrams of AtTPS10 promoter (A), AtTPS14 promoter (C) and AtTPS21 promoter (E). The black triangles represent G-box like motifs. A fragment of the four lines (I, II, III and IV), as indicated by the triangles was amplified in ChIP assay. The fragment without G-box like motifs was used as a control. The end positions of each fragment (kb) relative to the transcription start site are indicated below. UTR, untranslated region. (B, D and F) Fold enrichment of YFP-AtPIF3 associated with each of the DNA fragments of AtTPS10 promoter (B), AtTPS14 promoter (D) and AtTPS21 promoter (F) in ChIP assay. Values are mean ± SD (n = 4). The same letters above the bars indicate lack of significant difference at the 0.05 level by Duncan’s multiple range test. (G) Schematic diagram showed effector and reporter constructs used in H. AtTPS10 promoter: luciferase (LUC) was used as a reporter construct. 35S promoter-driven YFP, AtPIFs, and βC1 were used as effector constructs. (H) Effects of βC1 on transcriptional activity of each AtPIFs (AtPIF1, AtPIF3, AtPIF4, or AtPIF5) on AtTPS10 promoter under white light. Values are mean ± SD (n = 8) (*, P< 0.05; **, P< 0.01; Student’s t-test).

