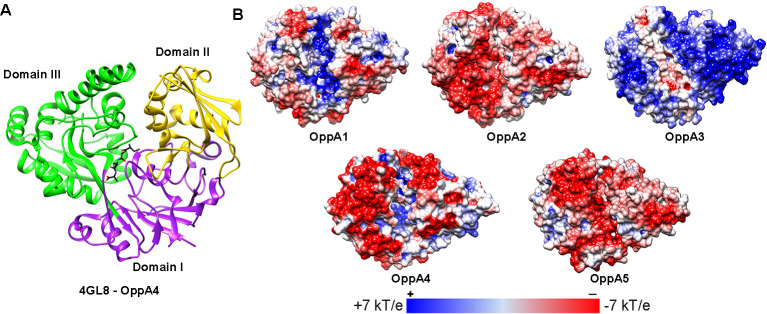
Fig 8. The binding pockets of OppA1-5 demonstrate variations in electrostatic distribution.
(A) Ribbon model of OppA4 crystal structure (PDB: 4GL8) [26] showing domains I (purple–hinge region), II (yellow), and III (green) and the Ala4 liganded peptide (black). (B)Electrostatic distributions unliganded (open) OppA1-5, modeled against unliganded E. coli OppA (PDB: 3TCH) [24]. Electrostatic models have been rotated 45° on the z-axis to show the permease-binding regions (region framing the binding site as clearly seen on the positively charged surface of OppA3) or the binding pockets (clearly distinguished as the positively charged pocket along the center of OppA1). Figure was adapted from Groshong et al. [14].

